
Overview
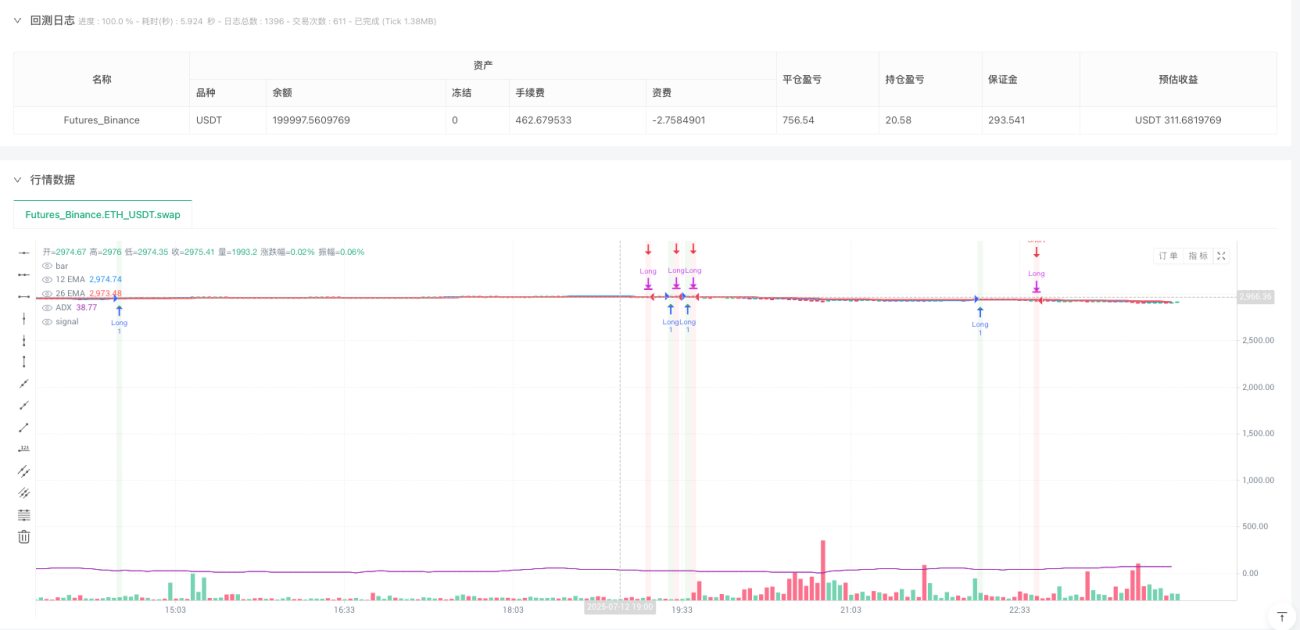
This strategy is a quantitative trading system based on moving average crossovers and trend confirmation, utilizing the crossover signals between short-term 12-period and long-term 26-period Exponential Moving Averages (EMA), combined with Average Directional Index (ADX) filter and volume confirmation on a 5-minute timeframe. The strategy primarily aims to capture trend changes by identifying strong trends and filtering out false signals in ranging markets, designed to improve trading success rate and capital efficiency.
Strategy Principles
The core logic of this strategy is built on the combined application of several key technical indicators:
-
Moving Average Crossover System: Uses 12-period EMA as the fast line and 26-period EMA as the slow line. A buy signal is generated when the fast line crosses above the slow line; a sell signal is formed when the fast line crosses below the slow line.
-
ADX Trend Filter: Incorporates a 14-period ADX (Average Directional Index) as a trend strength confirmation tool. The strategy requires an ADX value greater than 25, ensuring trades are only executed in clearly trending markets, effectively avoiding false signals in ranging markets.
-
Precise Entry and Exit Rules:
- Long Entry: 12 EMA crosses above 26 EMA with ADX > 25
- Short Entry: 12 EMA crosses below 26 EMA with ADX > 25
- Long Exit: 2% stop loss or 12 EMA crosses below 26 EMA
- Short Exit: 2% stop loss, 3% take profit, or 12 EMA crosses above 26 EMA
-
Custom ADX Calculation: The strategy employs a custom method to calculate ADX, including Directional Movement (DM), True Range (TR), and smoothing of various indicators, ensuring accuracy and sensitivity of the indicator.
Strategy Advantages
Through in-depth code analysis, this strategy demonstrates the following significant advantages:
-
Trend Filtering Mechanism: The introduction of the ADX indicator significantly reduces false signals in ranging markets, ensuring trades are only executed in clearly trending environments, substantially improving win rate.
-
Flexible Risk Management: The strategy incorporates built-in 2% fixed stop loss and 3% take profit settings (for short trades), controlling single-trade risk through hard stops and enhancing capital security.
-
Multiple Confirmation Mechanism: Through dual confirmation with EMA crossovers and ADX, the strategy enhances signal reliability and reduces the probability of misjudgments.
-
Visualization of Trading Signals: The strategy provides clear visual indications, including graphical markers for buy/sell signals, background highlighting, and label annotations, allowing traders to quickly identify and verify signals.
-
Integrated Alert Functionality: Built-in trading signal alerts enable real-time notifications, reducing the risk of missing trading opportunities.
-
Parameter Adjustability: All key parameters can be adjusted according to market conditions and personal preferences, including EMA periods, ADX threshold, stop loss and take profit percentages, enhancing strategy adaptability.
Strategy Risks
Despite its well-designed framework, the strategy has the following potential risks:
-
Rapid Reversal Risk: In highly volatile markets, prices may quickly reverse after a signal is triggered, causing stop losses to be hit. Solution: Consider increasing the ADX threshold or pausing trading during periods of high volatility.
-
Trend Exhaustion Risk: Entry may occur in the late stages of a trend, limiting profit potential. Solution: Integrate other momentum indicators or Fibonacci retracement levels for secondary confirmation.
-
Parameter Sensitivity: The choice of EMA and ADX parameters significantly impacts strategy performance. Solution: Optimize parameters through historical backtesting to find the most suitable combination for specific market conditions.
-
Slippage and Execution Delay: Trading on a 5-minute timeframe may face slippage and execution delay issues. Solution: Consider adding additional price confirmation or using limit orders instead of market orders.
-
Systemic Risk Exposure: During periods of extreme market volatility, stop losses may not execute effectively. Solution: Implement stricter money management rules, such as limiting risk per trade to 1% of total capital.
Strategy Optimization Directions
Based on code analysis, the strategy can be optimized in the following directions:
-
Dynamic ADX Threshold: Replace the fixed ADX threshold with a dynamic threshold based on market volatility, automatically adjusting filtering criteria in different market environments to improve adaptability. This is necessary because the same ADX threshold may be too strict or too loose in different volatility environments.
-
Introduce Volume Filter: Add volume confirmation conditions to existing signals, requiring volume at signal trigger to be higher than recent average levels, further reducing low-quality trading signals. High volume typically represents stronger market consensus.
-
Optimize Take Profit Strategy: Add dynamic take profit mechanisms for long trades, such as ATR-based trailing stops or target prices, balancing profit potential between long and short trades. The current strategy only sets fixed take profit for short positions.
-
Time Filter Integration: Add trading time filters to avoid low liquidity periods and major market announcement times, reducing the impact of adverse market conditions.
-
Multi-Timeframe Confirmation: Combine trend direction judgment from higher timeframes (such as 15-minute or 1-hour), only trading when trends across multiple timeframes align, improving success rate.
-
Add Pullback Entry Logic: After confirming trend direction, wait for price to pull back to key support/resistance levels before entering, optimizing entry points and improving risk-reward ratio.
Conclusion
The Dual EMA Trend Following Strategy with ADX Filter is a well-structured quantitative trading system that captures trend changes through moving average crossovers and filters weak trend markets using the ADX indicator, effectively improving trading quality. The strategy operates on a 5-minute timeframe, particularly suitable for short-term traders and day traders.
The strategy's main advantages lie in its multiple confirmation mechanisms and strict risk control, while its potential risks mainly come from trend exhaustion and market volatility. By implementing the suggested optimization measures, especially introducing dynamic ADX thresholds, volume filtering, and multi-timeframe confirmation, the performance of this strategy can be further enhanced.
For quantitative traders, this strategy provides a robust basic framework that can be customized according to personal preferences and specific market conditions to achieve long-term stable trading performance. Ultimately, the key to successfully applying this strategy lies in strictly executing trading rules, continuously monitoring strategy performance, and timely adjusting parameters according to market changes.
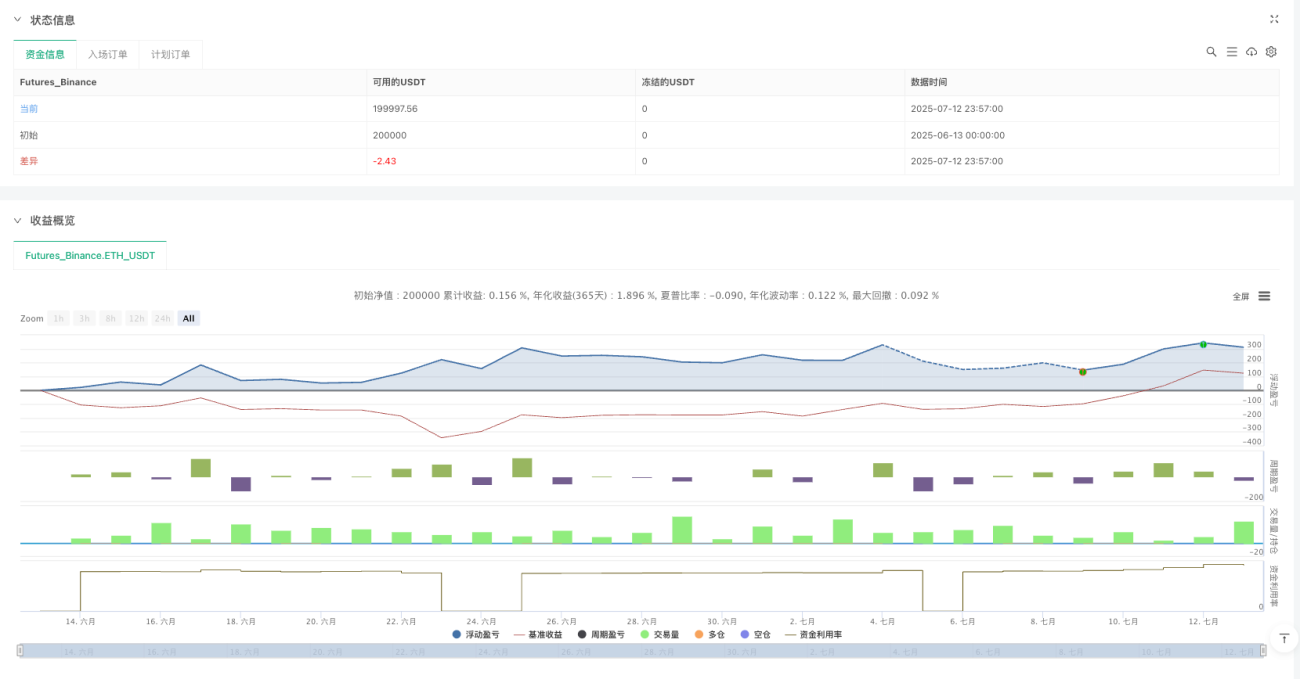
/*backtest
start: 2025-06-13 00:00:00
end: 2025-07-13 00:00:00
period: 3m
basePeriod: 3m
exchanges: [{"eid":"Futures_Binance","currency":"ETH_USDT","balance":200000}]
*/

//@version=5
strategy("Bitcoin 12/26 EMA Crossover with ADX Filter [5min Intraday]", overlay=true, margin_long=100, margin_short=100)

// Input parameters- 1