
Overview
The MACD-EMA Trend-Momentum Time-Filtered Trading Strategy is a sophisticated quantitative trading system designed to capture high-probability market opportunities. This strategy ingeniously combines the Exponential Moving Average (EMA) as a trend filter, Moving Average Convergence Divergence (MACD) as momentum confirmation, and a specific time-based session filter (based on GMT+7 timezone) to optimize trade execution timing. This multi-layered filtering mechanism is designed for intraday or short-term trading on smaller timeframes, while simultaneously managing risk and potential reward for each trade through an integrated Risk-Reward (RR) control system.
Strategy Principles
The core logic of the strategy is based on the collaborative functioning of three main components:
-
Trend Identification (EMA Filter): The strategy employs a 21-period Exponential Moving Average (EMA) as the primary trend indicator. When price is above the EMA, the market is considered to be in an uptrend; when price is below the EMA, the market is considered to be in a downtrend. This provides the primary condition for trade direction.
-
Momentum Confirmation (MACD Indicator): The strategy utilizes the MACD indicator (default parameters: fast line 12, slow line 26, signal line 9) to confirm market momentum. The positive or negative value of the MACD line is used to verify that the market momentum direction aligns with the trend direction indicated by the EMA.
-
Time Filter: The strategy implements a time-based filter based on the GMT+7 timezone, allowing traders to restrict trading to specific market sessions (default is 19:00-22:00 GMT+7). This helps focus on periods of higher liquidity or market efficiency.
Buy signal conditions:
- Price must be above the 21-period EMA (uptrend)
- MACD line must be positive (positive momentum)
- Closing price must be above opening price (current candle is bullish)
- No trade has been executed for the current day
- Time must be within the specified trading session (if time filter is enabled)
Sell signal conditions:
- Price must be below the 21-period EMA (downtrend)
- MACD line must be negative (negative momentum)
- Closing price must be below opening price (current candle is bearish)
- No trade has been executed for the current day
- Time must be within the specified trading session (if time filter is enabled)
For risk management, the strategy automatically sets Stop Loss (SL) and Take Profit (TP) levels for each trade. For buy trades, the stop loss is placed below the lowest point of the previous two candles plus a customizable pip buffer; for sell trades, the stop loss is placed above the highest point of the previous two candles plus the same buffer. The take profit level is calculated automatically based on a user-defined risk-reward multiplier.
Strategy Advantages
Through deep analysis of the strategy code, we can summarize the following key advantages:
-
Multiple Confirmation Mechanism: Combining EMA trend filtering and MACD momentum confirmation significantly increases the reliability of trading signals and reduces false signals.
-
Flexible Time Filtering: Allows traders to focus on specific, efficient market sessions, avoiding periods of low volatility or unpredictable market behavior.
-
Automated Risk Management: Built-in stop loss and take profit mechanisms ensure that each trade has predefined risk and reward objectives, helping maintain consistent risk management discipline.
-
Daily Trade Limitation: The design of allowing only one trade per day helps avoid overtrading and encourages the system to focus on higher-quality trading opportunities.
-
High Customizability: The strategy offers multiple adjustable parameters, including EMA period, MACD parameters, risk-reward ratio, pip buffer, etc., allowing traders to optimize according to different market conditions or personal risk preferences.
-
Visual Aids: Provides clear chart markings, including the EMA line, buy/sell signal shapes, and stop loss/take profit labels, facilitating intuitive understanding and verification of trading logic.
-
Prevention of Duplicate Entries: The strategy includes logic to ensure that no new entry signals are generated when a position is already open, avoiding unnecessary position accumulation.
Strategy Risks
Despite its well-designed structure, there are several potential risks that traders should be aware of:
-
Trend Reversal Risk: Relying on EMA as a trend indicator may result in delayed reactions during rapid market reversals, potentially leading to entries in the original trend direction early in a reversal. Solution: Consider adding more sensitive indicators or volatility filters to assist in identifying potential trend reversals.
-
Fixed Stop Loss Risk: The strategy uses stop loss settings based on the previous two candles plus a fixed buffer, which may not be flexible enough in markets with suddenly increasing volatility. Solution: Consider implementing dynamic stops based on ATR (Average True Range) to better adapt to varying market volatility conditions.
-
Time Filter Limitations: Fixed session filtering may miss favorable opportunities in other time periods, especially during global market events or unconventional market behavior. Solution: Add dynamic time filtering based on market activity or volatility, rather than relying solely on fixed time periods.
-
Opportunity Cost of Daily Trade Limit: Limiting to only one trade per day may miss better trading opportunities that appear later in the same day. Solution: Consider implementing more sophisticated trade management logic, such as allowing additional trades after the current trade reaches partial profit targets.
-
Parameter Sensitivity: The strategy's performance may be sensitive to EMA period and MACD parameter settings, and improper parameter optimization may lead to curve-fitting issues. Solution: Conduct extensive parameter sensitivity testing and ensure parameter robustness across multiple markets and timeframes.
Strategy Optimization Directions
Based on code analysis, the following are potential optimization directions for this strategy:
-
Dynamic Volatility Adjustment: Introduce the ATR (Average True Range) indicator to dynamically adjust stop loss and take profit levels to adapt to current market volatility, rather than using a fixed pip buffer. This will make the strategy more robust under different volatility conditions.
-
Enhanced Trend Confirmation: Consider adding additional trend confirmation indicators, such as ADX (Average Directional Index) or multi-period EMA combinations, to improve trend identification accuracy and reduce false signals in weak trend or ranging markets.
-
Dynamic Time Filtering: Implement dynamic time filtering based on market activity, for example, automatically identifying optimal trading sessions based on volume or volatility, rather than relying solely on predefined fixed time periods.
-
Partial Profit Mechanism: Introduce a staged profit-taking mechanism, allowing the strategy to lock in partial profits when reaching certain profit targets, while leaving the remaining position to capture larger market moves.
-
Volume Filter: Add volume confirmation requirements to ensure trades are executed only when there is sufficient market participation, which can improve signal quality and reduce slippage risk in low-liquidity environments.
-
Intelligent Daily Trade Limit: Improve the daily trade limit logic, for example, allowing a second trade after the first trade ends in profit, or dynamically adjusting the daily trade limit based on market condition quality.
-
Machine Learning Optimization: Consider implementing machine learning algorithms to dynamically optimize strategy parameters or weight different signal components, enabling the strategy to better adapt to different market environments.
-
Correlation Filtering: For multi-market trading, add correlation filters to avoid simultaneously holding positions in the same direction in highly correlated markets, thereby reducing concentration risk.
Summary
The MACD-EMA Trend-Momentum Time-Filtered Trading Strategy is a well-structured quantitative trading system that creates a multi-layered decision framework by integrating EMA trend filtering, MACD momentum confirmation, and time filtering, designed to capture high-probability trading opportunities. The strategy's built-in risk management mechanisms and daily trade limits help maintain trading discipline, while its highly customizable parameter settings enable it to adapt to different market conditions and trading styles.
Although the strategy has some inherent risks, such as trend reversal lag and limitations of fixed stop loss settings, these risks can be mitigated through the suggested optimization directions, such as implementing dynamic volatility adjustments, enhancing trend confirmation mechanisms, and intelligent trade management features.
Overall, this strategy represents a balanced trading approach that combines multiple aspects of technical analysis and enhances trading quality through strict risk management and time filtering. For traders seeking a structured approach to intraday or short-term trading, this is a valuable starting point that can be further customized and optimized according to individual trading needs and risk preferences.
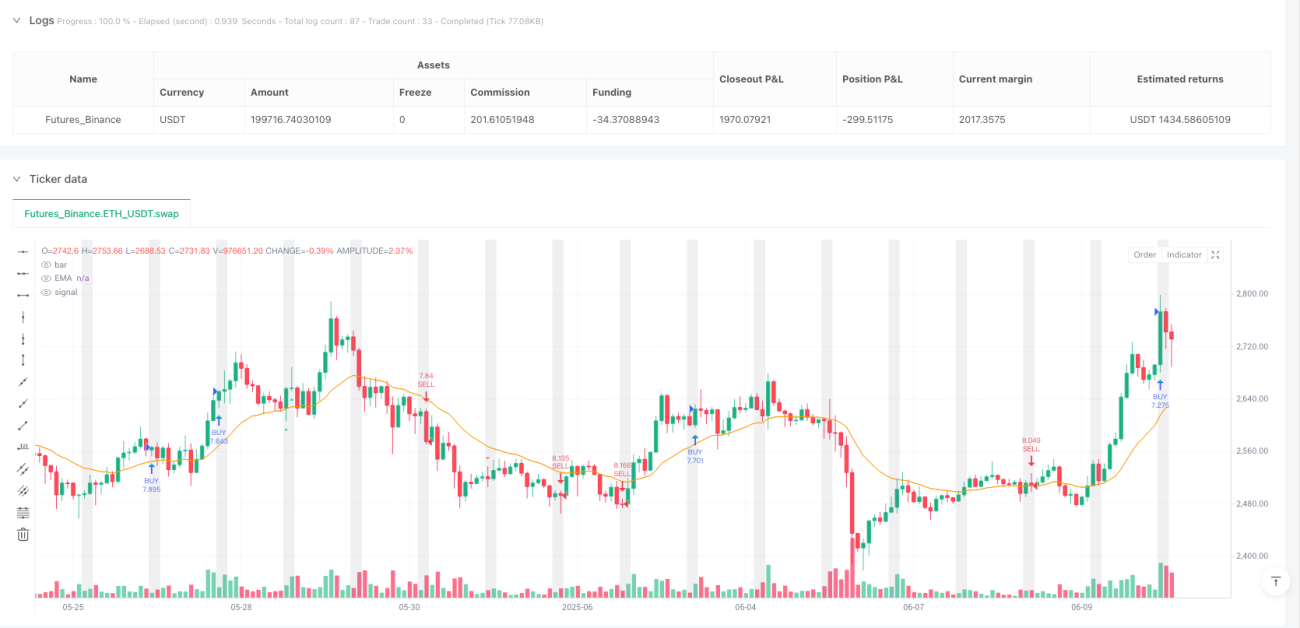
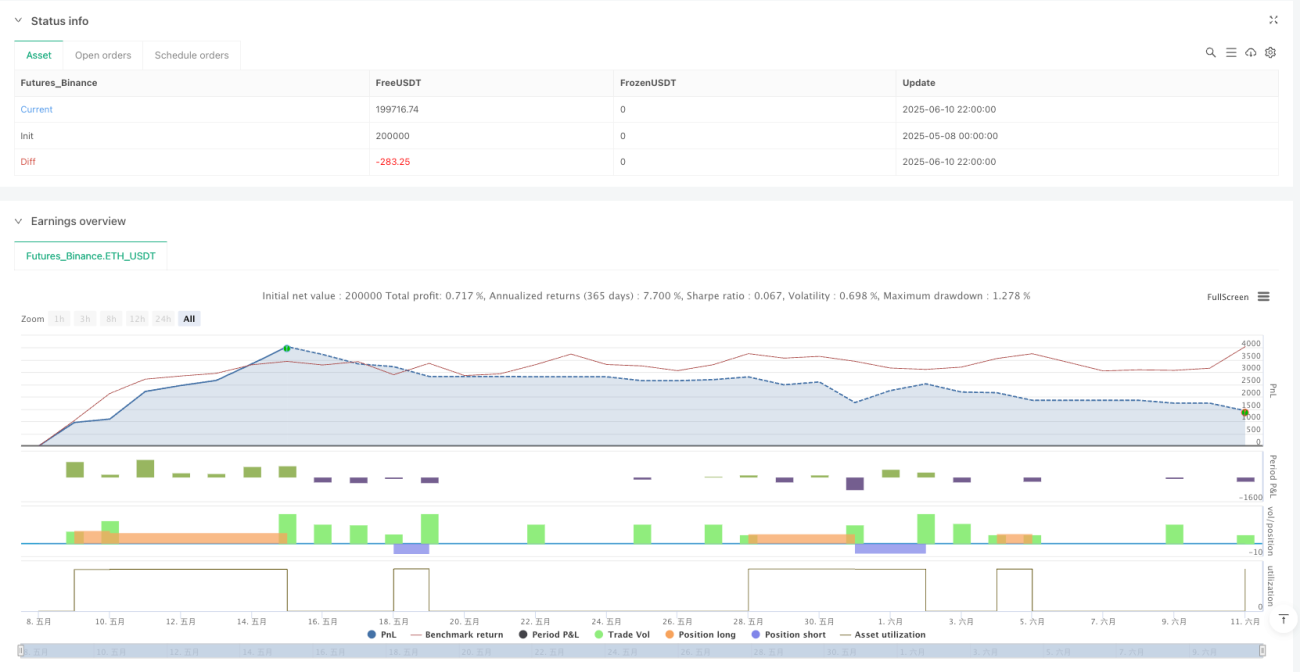
/*backtest
start: 2025-05-08 00:00:00
end: 2025-06-11 00:00:00
period: 2h
basePeriod: 2h
exchanges: [{"eid":"Futures_Binance","currency":"ETH_USDT","balance":200000}]
*/

//@version=5
strategy("MACD EMA + Time Filter", overlay=true, default_qty_type=strategy.percent_of_equity, default_qty_value=10)

// ==== Inputs ====- 1