
Overview
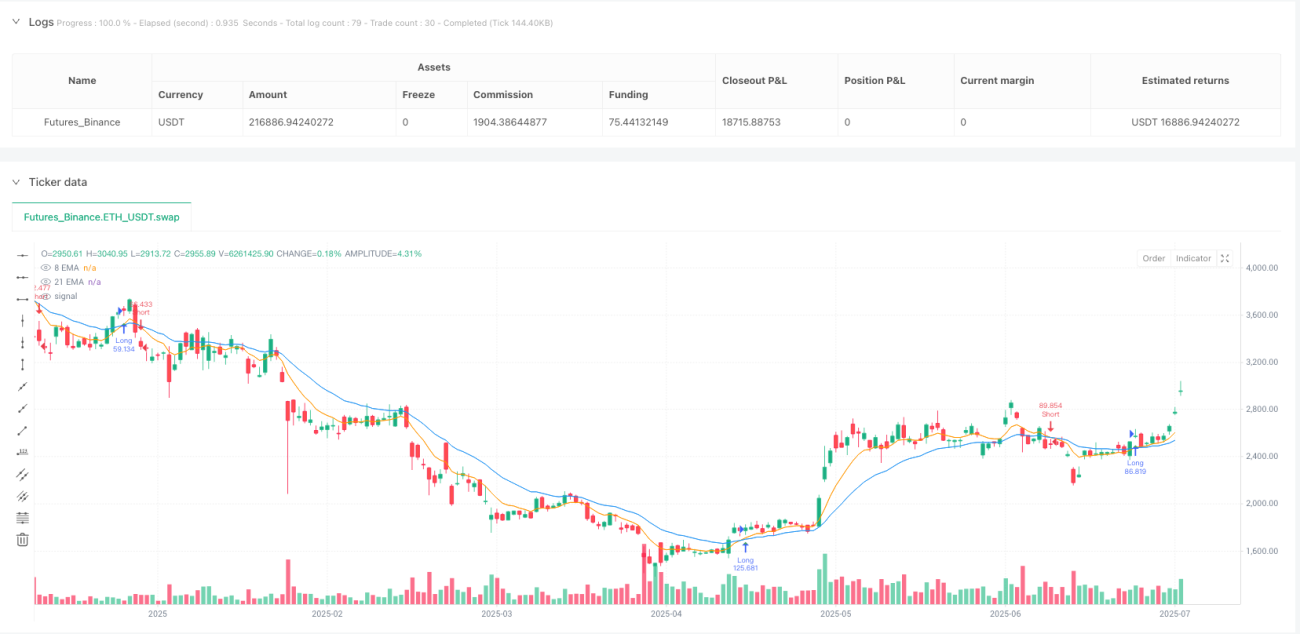
The Dual EMA Crossover Momentum Trading System is a momentum-based trading strategy that utilizes the classic 8/21 Exponential Moving Average (EMA) crossover to identify trend reversals and generate long and short trading signals. This strategy includes built-in take profit and stop loss parameters to automatically manage risk and lock in profits. The core logic triggers a long entry when the 8-period EMA crosses above the 21-period EMA (bullish signal), and a short entry when the 8-period EMA crosses below the 21-period EMA (bearish signal). Each position automatically exits upon hitting either a predefined take profit (defined as a percentage gain from entry) or a stop loss (defined as a percentage loss from entry).
Strategy Principles
The core principle of this strategy is based on the crossover relationship between two exponential moving averages of different periods to determine changes in market trend direction. The strategy implementation includes several key components:
-
Indicator Calculation:
- Short-period EMA (8 periods):
shortEma = ta.ema(close, shortEmaLength) - Long-period EMA (21 periods):
longEma = ta.ema(close, longEmaLength)
- Short-period EMA (8 periods):
-
Trading Conditions:
- Long condition:
longCondition = ta.crossover(shortEma, longEma) - Short condition:
shortCondition = ta.crossunder(shortEma, longEma)
- Long condition:
-
Risk Management:
- Dynamic calculation of percentage-based take profit and stop loss levels
- Long take profit:
longTakeProfit = close * (1 + takeProfitPerc / 100) - Long stop loss:
longStopLoss = close * (1 - stopLossPerc / 100) - Short take profit:
shortTakeProfit = close * (1 - takeProfitPerc / 100) - Short stop loss:
shortStopLoss = close * (1 + stopLossPerc / 100)
-
Trade Execution:
- Strategy checks if there's no open position:
noOpenPosition = strategy.position_size == 0 - New trade signals are executed only when there's no open position
- Take profit and stop loss exit conditions are set simultaneously with entry
- Strategy checks if there's no open position:
This design ensures that the strategy can quickly capture opportunities when trends change while protecting capital through preset risk parameters.
Strategy Advantages
Through in-depth code analysis, this strategy demonstrates the following significant advantages:
-
Simple and Effective Trend Identification: The 8/21 EMA crossover is a widely validated method for trend identification that effectively captures market momentum changes.
-
Comprehensive Risk Management: The built-in take profit and stop loss mechanisms automatically protect capital and lock in profits, greatly reducing the risk of emotional trading.
-
Flexible Parameter Configuration: Users can adjust EMA period lengths, take profit, and stop loss percentages based on different markets and personal risk preferences.
-
Bidirectional Trading Capability: The strategy supports both long and short positions, allowing for opportunities in various market environments.
-
Prevention of Overlapping Trades: The strategy design ensures that no new trade is opened until the current one is fully closed, avoiding the risks of overtrading and capital dispersion.
-
Clear Visualization: By plotting EMA lines and trade signal markers, traders can intuitively understand the strategy's operational status.
-
Wide Applicability: The strategy is compatible with various trading instruments and timeframes, including cryptocurrencies, forex, stocks, and indices.
Strategy Risks
Despite its well-designed structure, the strategy still presents the following potential risks:
-
Poor Performance in Ranging Markets: In sideways markets without clear trends, EMA crossover signals may appear frequently, resulting in multiple stop loss exits.
-
Limitations of Fixed Percentage Take Profit/Stop Loss: Different markets and timeframes have significant variations in volatility, and fixed percentage take profit/stop loss may not be suitable for all situations.
-
Slippage and Execution Risk: In live trading, orders may not be executed precisely at the prices generated by the strategy, especially in markets with lower liquidity.
-
Over-reliance on Historical Data: Strategy parameters are optimized based on historical data, but future market behavior may change.
-
Single Indicator Dependency: The strategy relies solely on EMA crossovers without using auxiliary indicators to confirm signals, which may lead to false signals.
To mitigate these risks, it is recommended to:
- Conduct thorough backtesting under different market conditions
- Adjust take profit and stop loss parameters based on the specific asset's volatility
- Consider adding trade filters to reduce false signals in ranging markets
- Use smaller position sizes to manage overall risk
Strategy Optimization Directions
After analyzing the code, here are possible optimization directions:
-
Add Trend Filter: Introduce additional indicators (such as ADX) to confirm whether the market is in a trending state, trading only in strong trend environments.
adxLength = input.int(14, title="ADX Length") adxThreshold = input.int(25, title="ADX Threshold") adxValue = ta.adx(high, low, close, adxLength) isTrending = adxValue > adxThreshold -
Dynamic Take Profit/Stop Loss: Dynamically adjust take profit and stop loss levels based on market volatility (such as ATR), rather than fixed percentages.
atrPeriod = input.int(14, title="ATR Period") atrMultiplierSL = input.float(2.0, title="ATR Multiplier for Stop Loss") atrMultiplierTP = input.float(3.0, title="ATR Multiplier for Take Profit") atrValue = ta.atr(atrPeriod) dynamicStopLoss = atrValue * atrMultiplierSL dynamicTakeProfit = atrValue * atrMultiplierTP -
Add Trading Time Filter: Avoid trading during high volatility periods at market open and close.
-
Partial Profit Locking Mechanism: Move stop loss to break-even or partially close positions when trades reach a certain profit level.
-
Add Volume Confirmation: Combine volume indicators to confirm the validity of EMA crossover signals, executing trades only when volume increases.
volumeCondition = volume > ta.sma(volume, 20) * 1.2 validLongCondition = longCondition and volumeCondition -
Optimize Entry Timing: Consider using price pullbacks to the moving average as more optimal entry points, rather than just crossover signals.
These optimization directions can not only improve the strategy's robustness but also adapt to different market environments, enhancing overall profitability while reducing risk.
Summary
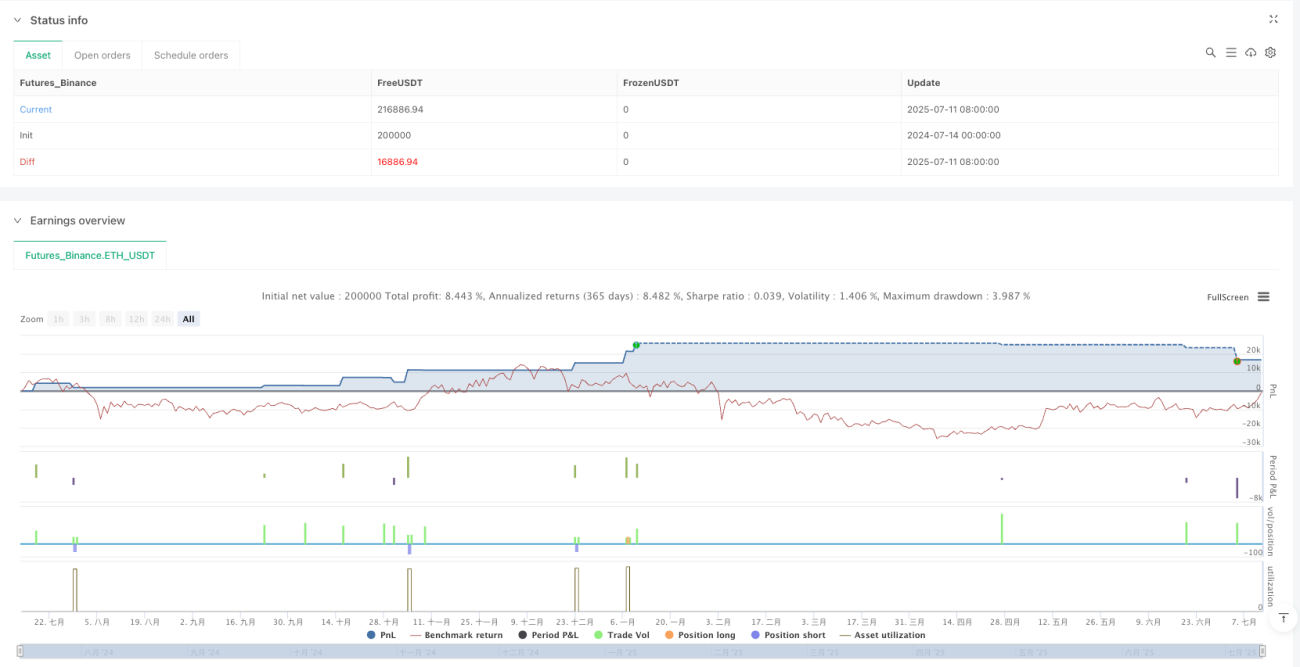
The Dual EMA Crossover Momentum Trading System is a clearly structured, easy-to-understand, and implement trading strategy. It uses 8/21 EMA crossover signals to capture market trend changes and automatically manages risk through preset take profit and stop loss parameters. This strategy is applicable to various trading instruments and timeframes, performing particularly well in markets with clear trends.
The main advantages of the strategy lie in its concise logic and comprehensive risk management mechanisms, which highly automate the trading process and reduce interference from emotional factors. At the same time, the design that prevents overlapping trades avoids the risk of overtrading.
However, the strategy may face challenges in ranging markets and needs to be enhanced through optimization measures such as adding trend filters and dynamic take profit/stop loss to improve its adaptability. Additionally, combining volume confirmation and optimizing entry timing are effective ways to enhance strategy performance.
Overall, this is a strategy that balances simplicity and effectiveness, suitable as a starting point for beginners entering automated trading, and can also serve as part of an experienced trader's portfolio. Through reasonable parameter adjustments and continuous optimization, this strategy can maintain stable performance under various market conditions.
/*backtest
start: 2024-07-14 00:00:00
end: 2025-07-12 08:00:00
period: 1d
basePeriod: 1d
exchanges: [{"eid":"Futures_Binance","currency":"ETH_USDT","balance":200000}]
*/

//@version=5
strategy("JWs Algo", overlay=true, default_qty_type=strategy.percent_of_equity, default_qty_value=100)

// === INPUTS ===- 1