
Strategy Overview
The Smart Dollar-Cost Averaging Strategy is a long-position trading system based on the Dollar-Cost Averaging (DCA) method, optimizing asset accumulation through a combination of base orders and safety orders. This strategy automatically increases buying power during market downturns and closes all positions when reaching preset profit targets, achieving cyclical profits. The core design includes initial fixed-amount entry, multi-layered safety order additions, dynamic average cost calculation, and precise take-profit exit mechanisms, particularly suitable for long-term asset accumulation in volatile markets.
Strategy Principles
This strategy is based on the core concept of cost averaging but significantly enhanced through a multi-layered safety order mechanism. The strategy execution process is as follows:
-
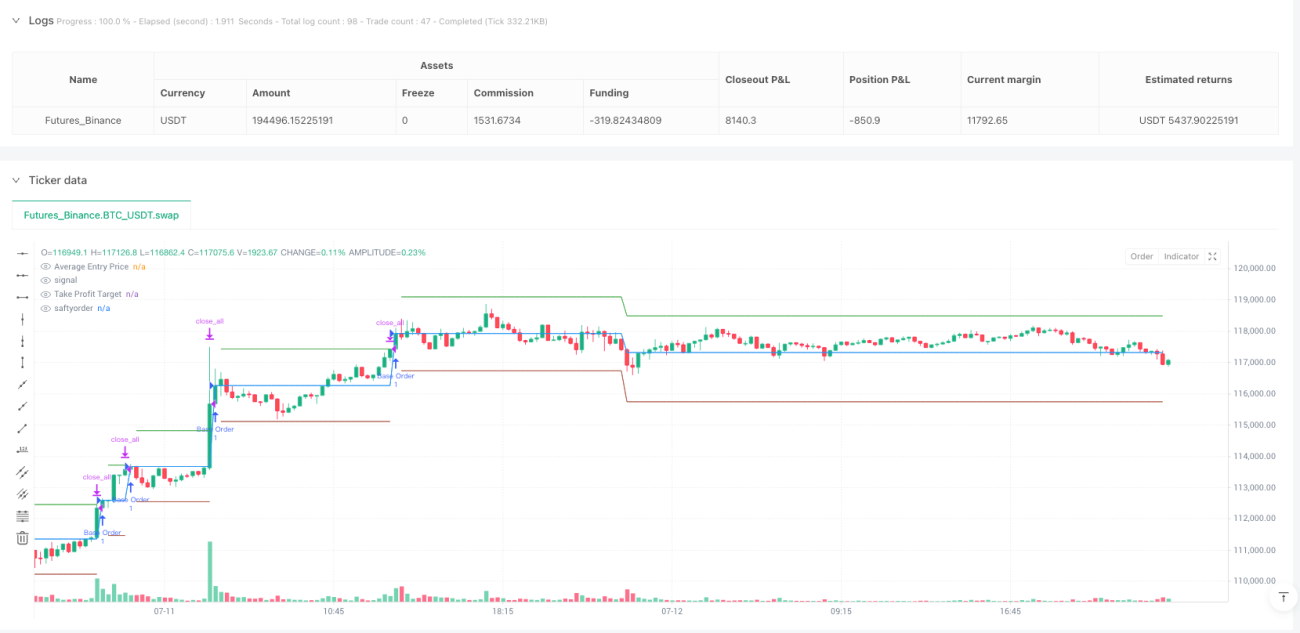
Base Order Entry: When no position is open, the system buys at the current price with a preset fixed dollar amount (baseOrderSize), recording the entry price and quantity.
-
Safety Order Trigger Mechanism: During position holding, if the price drops beyond the preset deviation percentage (priceDeviation) and the maximum safety order limit has not been reached, the system triggers additional buying.
-
Dynamic Order Size Adjustment: Each safety order's size is dynamically expanded through a multiplier (orderSizeMultiplier), calculated as: baseOrderSize * orderSizeMultiplier^(safetyOrderCount+1).
-
Average Cost Calculation: The system tracks total cost and total quantity in real-time, dynamically calculating the average entry price by dividing total cost by total quantity.
-
Take-Profit Exit Mechanism: When the market price rises to the average cost plus the preset profit target percentage, the system automatically closes all positions, completing a full trading cycle.
The strategy employs a cyclical design, resetting all counters and tracking variables after each position closure, preparing to start the next trading cycle.
Strategy Advantages
-
Cost Averaging Effect Maximization: The system automatically increases buying during price drops, significantly lowering the average holding cost and improving future profit potential.
-
Automated Risk Control: Through the preset safety order mechanism, the strategy can execute additional purchases during market downturns according to a predefined plan, avoiding emotional decision-making.
-
Capital Utilization Efficiency Optimization: Through the order size multiplier design, the strategy can invest more capital during price drops, accumulating more assets at more favorable price points.
-
Precise Profit Target Management: The dynamic take-profit mechanism based on average entry price ensures that each trading cycle can lock in profits when reaching the preset profit target.
-
High Customizability: Users can adjust base order size, deviation percentage, maximum safety orders, order size multiplier, and profit target according to different market conditions and personal risk preferences.
-
Visualization of Trading References: The strategy provides real-time visualization of average entry price, take-profit target price, and safety order trigger price, facilitating trading decisions.
Strategy Risks
-
Capital Depletion in Declining Markets: In continuously declining markets, the strategy may quickly consume available capital, especially when setting a high order size multiplier. The solution is to reasonably set the maximum number of safety orders and adjust the base order size according to market cycles.
-
Lack of Stop-Loss Mechanism: The current strategy design lacks a stop-loss mechanism, which may lead to significant losses under extreme market conditions. Implementing conditional stop-losses or time-based stop-losses is recommended to limit potential losses.
-
Parameter Sensitivity: Strategy performance is highly dependent on parameter settings, and inappropriate parameter combinations may lead to poor results. It is recommended to find optimal parameter combinations through historical data backtesting.
-
No Market Trend Recognition: The strategy does not include trend recognition mechanisms and may enter too early in strong downtrends. Consider integrating simple trend indicators as entry filtering conditions.
-
Liquidity Risk: In low-liquidity markets, large-scale safety orders may face slippage or execution difficulties. It is recommended to apply in high-liquidity markets or add liquidity check mechanisms.
Strategy Optimization Directions
-
Trend Filter Integration: Integrate simple trend recognition indicators (such as moving average crossovers or relative strength index) into the entry logic to avoid early position building in strong downtrends. Such optimization can significantly improve the strategy's risk-adjusted returns.
-
Dynamic Deviation Percentage: Dynamically adjust the trigger deviation percentage for safety orders based on market volatility, setting larger deviations in high-volatility markets and smaller deviations in low-volatility markets to adapt to different market environments.
-
Partial Take-Profit Mechanism: Introduce a tiered take-profit mechanism, allowing partial position closure when certain profit levels are reached, rather than full exit. This can lock in partial profits while maintaining some market exposure.
-
Risk Management Enhancement: Add conditional stop-losses based on time or price, as well as maximum loss limits, to prevent excessive losses under extreme market conditions.
-
Capital Management Optimization: Implement more sophisticated capital management algorithms that dynamically adjust order sizes based on account size, market volatility, and current profit/loss status, rather than simply using fixed multipliers.
-
Drawdown Control: Add adaptive parameter adjustment mechanisms based on historical drawdown analysis, automatically reducing order size or increasing deviation percentage when detecting significant drawdowns to alleviate capital pressure in declining markets.
Conclusion
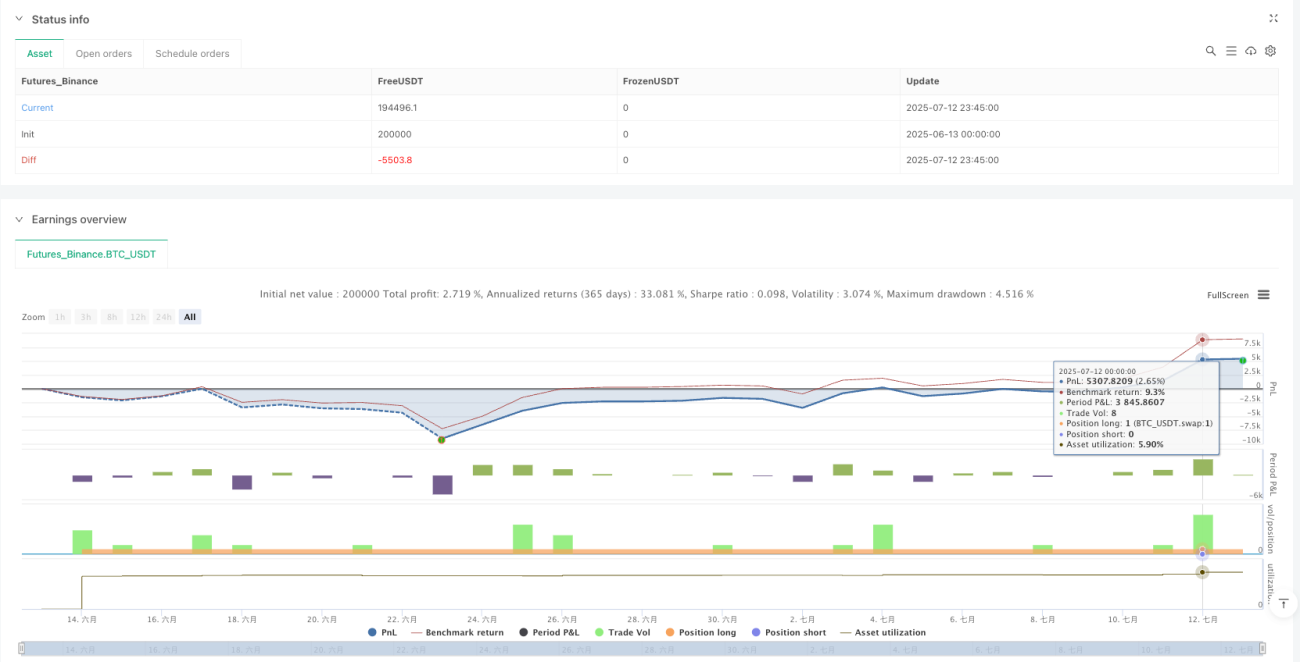
The Smart Dollar-Cost Averaging Strategy provides a systematic method for long-term asset accumulation by combining base order entry and multi-layered safety order additions. This strategy is particularly suitable for markets with cyclical fluctuations, effectively utilizing price pullbacks to accumulate more assets and locking in profits during rebounds.
The main advantages of the strategy lie in its simple yet powerful cost averaging effect maximization mechanism and clear profit target management, but it also faces risks such as capital depletion in declining markets and lack of stop-loss mechanisms. By integrating trend filtering, dynamic parameter adjustments, and enhanced risk management features, this strategy can be further optimized to improve its adaptability and performance across different market environments.
For investors seeking systematic methods to accumulate assets and manage risk in volatile markets, this enhanced DCA strategy provides a reliable and customizable framework, particularly suitable for medium to long-term investment timeframes.
- 1