
Overview
The Quantum Harmonic Dynamic Support Breakout Strategy is an innovative trading system that combines a Quantum Harmonic Moving Average (SHMA) with dynamic support levels. The strategy focuses on price breakouts above key support levels and uses a proprietary SHMA indicator to optimize exit timing. This approach not only leverages the support breakout concept from technical analysis but also introduces quantum computing principles through a harmonic feedback mechanism to enhance decision-making quality. The strategy focuses on capturing upward trends and is a pure long-only approach, suitable for rising or ranging markets.
Strategy Principles
The core principles of this strategy are based on two key components: dynamic support identification and the Quantum Harmonic Moving Average (SHMA).
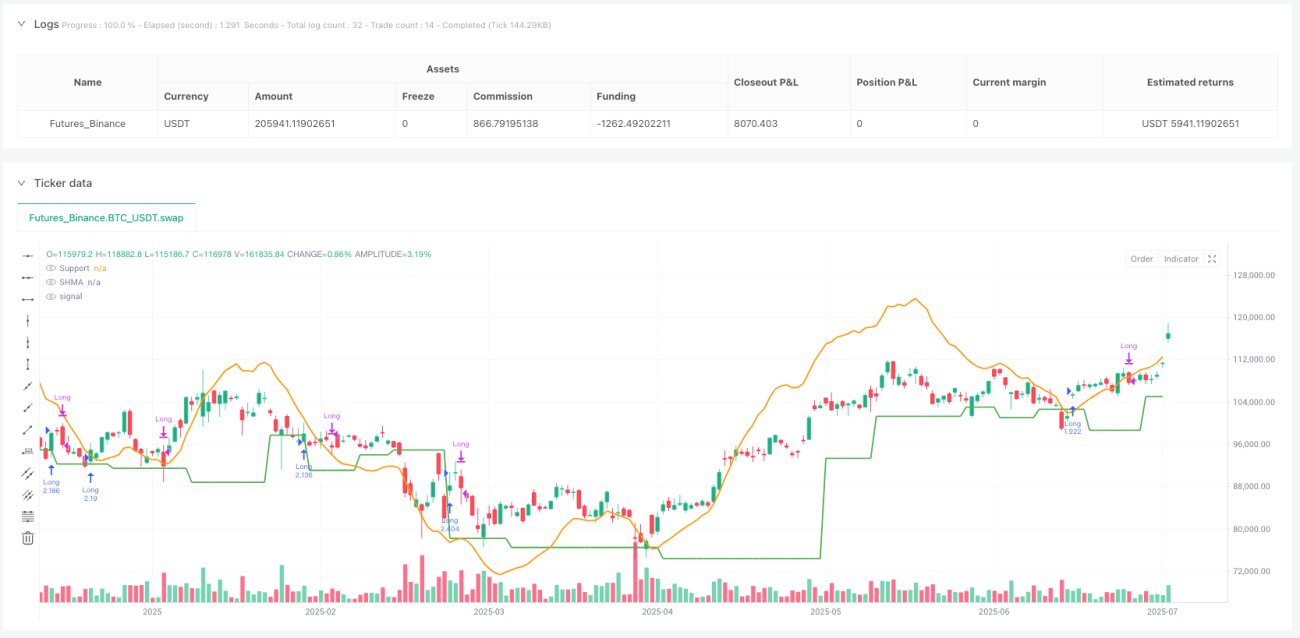
First, the strategy uses a dynamic support identification mechanism by finding recent pivot lows to determine support levels. Specifically, it uses the ta.pivotlow function, configuring the number of bars to the left and right (default 5 each) to identify support. When price breaks above this support from below, the system triggers a long signal.
Second, the strategy employs the innovative Quantum Harmonic Moving Average (SHMA) as a filter and exit tool. SHMA builds on the foundation of Harmonic Average (HMA), adding a quantum wave function (psi) to capture minute price oscillations. The SHMA calculation consists of three steps:
- Calculate the Harmonic Average (HMA), which is a weighted average of price reciprocals
- Calculate the quantum wave function (psi) using a sine function to simulate quantum oscillations between price and the base HMA
- Calculate the energy level using an Exponential Moving Average (EMA) to smooth the wave function
- The final SHMA value is the base HMA plus an energy correction term modulated by the alpha parameter
Entry conditions are clear: a long signal is triggered when the closing price crosses above the support line. Exit conditions have three scenarios:
- Immediate exit when price hits the stop loss level
- When price reaches the take profit level, either exit immediately or wait for SHMA cross confirmation (configurable)
- If waiting for SHMA confirmation is chosen, exit when price falls below the SHMA line
The entire strategy is flexible through user-configurable parameters, including support detection parameters, take profit and stop loss levels, SHMA length, and quantum alpha value.
Strategy Advantages
-
Dynamic Market Adaptation: Using dynamic support identification rather than fixed levels allows the strategy to adapt to different market environments and changes in price structure.
-
Quantum Harmonic Optimization: The SHMA indicator, by introducing quantum harmonic principles, captures minute price oscillations that traditional moving averages might miss, improving signal quality.
-
Flexible Exit Mechanism: The strategy offers multiple exit options, allowing either immediate exit at take profit or waiting for SHMA crossover signals to confirm trend reversal before exiting, increasing the strategy's adaptability.
-
Fully Customizable: All key parameters can be adjusted through user inputs, including support detection sensitivity, risk-reward ratio, and SHMA characteristics, allowing traders to optimize according to their personal risk preferences and market conditions.
-
Originality: This is not a simple combination of indicators but an innovative approach applying quantum principles to technical analysis, providing a new perspective for trading decisions.
-
Clear Visualization: The strategy plots support lines and SHMA lines on the chart, allowing traders to visually understand entry and exit signals.
Strategy Risks
-
False Breakout Risk: Dynamic support breakouts may generate false signals, especially in highly volatile markets. The solution is to add confirmation indicators or adjust support detection parameters (increase left/right bar counts) to reduce noise.
-
Parameter Sensitivity: The alpha parameter and length of SHMA significantly affect results, and improper settings may lead to overfitting or signal lag. It is recommended to optimize parameters for different market conditions through historical backtesting.
-
Unidirectional Strategy Limitations: As a pure long-only strategy, it may underperform in downtrend markets. Consider adding trend filters or market state recognition mechanisms to activate the strategy only in favorable environments.
-
Stop Loss Trigger Risk: If stop loss is set too tight, it may be triggered during normal market fluctuations. Stop loss levels should be carefully set based on the volatility characteristics of the target market.
-
Quantum Model Complexity: The quantum harmonic model increases strategy complexity, potentially making strategy behavior less intuitive and increasing the difficulty of parameter tuning. Beginners should take time to understand how SHMA works.
Strategy Optimization Directions
-
Add Trend Filters: Consider adding broader trend indicators (such as long-term moving averages or ADX) to filter signals, trading only in confirmed uptrends. This will reduce the risk of counter-trend trading and improve overall success rates.
-
Dynamic Stop Loss Mechanism: The current strategy uses fixed percentage stop losses; consider implementing dynamic stop losses based on ATR or historical volatility to better adapt to volatility characteristics in different market conditions.
-
Add Volume Confirmation: The reliability of support breakout signals can be enhanced through volume confirmation. When a breakout occurs with significant volume increase, it typically indicates a more reliable breakout.
-
Multi-timeframe Analysis: By integrating trend information from higher timeframes, the quality of entry decisions can be improved. For example, only look for long opportunities in lower timeframes when an uptrend is confirmed on the daily chart.
-
Optimize SHMA Parameters: Conduct more in-depth optimization research on SHMA's length and alpha parameters, potentially establishing parameter sets for different market conditions. Particularly consider how the alpha parameter affects the strength of energy correction and its impact on strategy performance.
-
Increase Statistical Analysis: Add more statistical analysis functions to the strategy, such as real-time calculation of win rate, risk-reward ratio, maximum drawdown, and other metrics to help traders better understand strategy performance.
Conclusion
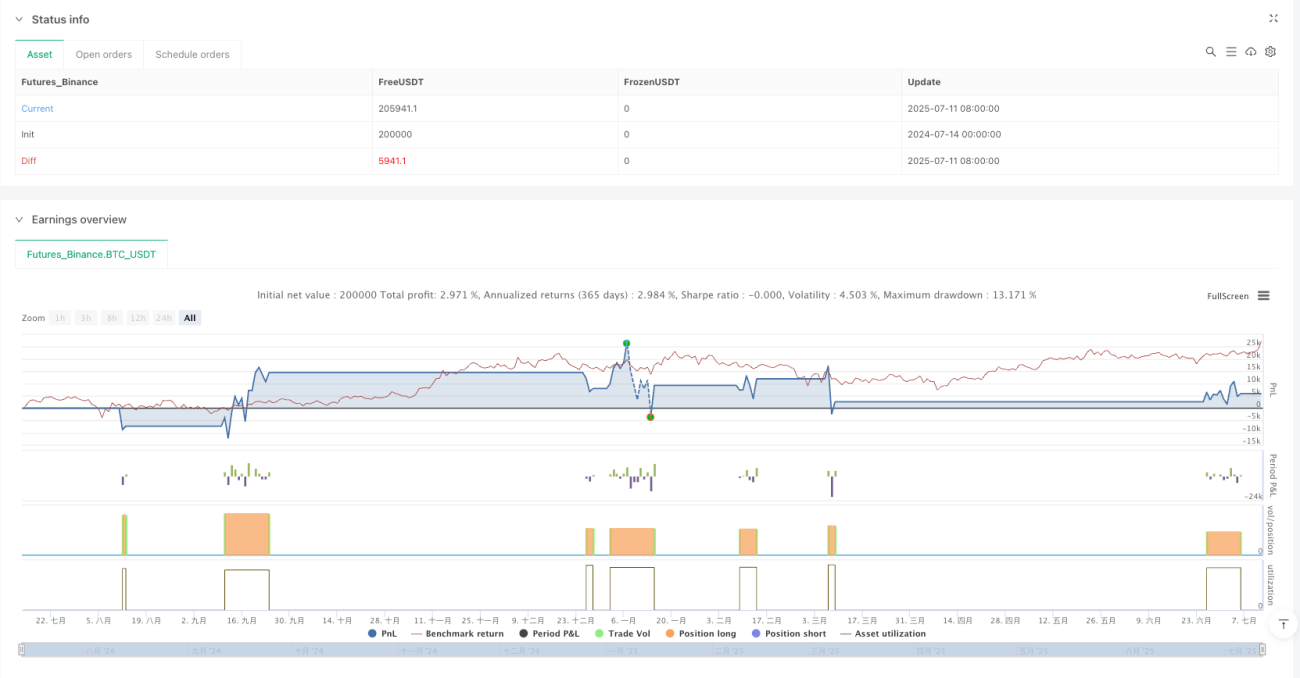
The Quantum Harmonic Dynamic Support Breakout Strategy is an innovative long-only trading system that optimizes entry and exit decisions by combining dynamic support identification with the Quantum Harmonic Moving Average (SHMA). The core advantages of the strategy lie in its dynamic adaptability and sensitivity to minute price movements, thanks to the quantum harmonic principles of SHMA. While the strategy faces risks such as false breakouts and parameter sensitivity, these risks can be effectively managed through reasonable parameter settings and the suggested optimization directions.
This strategy is particularly suitable for traders seeking innovative technical analysis methods and investors with a strong interest in quantitative trading. By introducing quantum computing concepts into technical analysis, the strategy represents an interesting new direction in financial market analysis. However, as with all trading strategies, thorough backtesting and risk assessment should be conducted before use, and it should be part of a broader trading plan rather than used in isolation.
/*backtest
start: 2024-07-14 00:00:00
end: 2025-07-12 08:00:00
period: 1d
basePeriod: 1d
exchanges: [{"eid":"Futures_Binance","currency":"BTC_USDT","balance":200000}]
*/

//@version=6
strategy("SHMA + Cassure de Support (Long Only)", overlay=true, default_qty_type=strategy.percent_of_equity, default_qty_value=100)

// === ⬇️ PARAMÈTRES UTILISATEUR ===- 1