
Overview
The Multi-Indicator Trend Following & Momentum Confirmation Trading Strategy is a quantitative trading system that combines multiple technical indicators, primarily utilizing the Exponential Moving Average (EMA), Relative Strength Index (RSI), and Volume Moving Average to identify potential trading opportunities. The core concept of this strategy is to confirm trend direction as a foundation, then use momentum indicators and volume confirmation to enhance signal quality, while applying dynamic stop-loss and take-profit settings based on Average True Range (ATR) to optimize risk-reward management.
Strategy Principles
This strategy's trading logic is based on multi-level market condition confirmation, divided into four key components: trend determination, momentum confirmation, volume verification, and candlestick pattern confirmation:
-
Trend Determination:
- Long trend condition: Price above the 21-period EMA, with the 21-period EMA rising
- Short trend condition: Price below the 21-period EMA, with the 21-period EMA falling
-
Momentum Confirmation:
- Long momentum condition: 14-period RSI greater than 55 and increasing (for 2 consecutive periods)
- Short momentum condition: 14-period RSI less than 45 and decreasing (for 2 consecutive periods)
-
Volume Verification:
- Trading signals must be supported by volume higher than the 20-period volume moving average
-
Candlestick Pattern Confirmation:
- Long signals require the current candle to be bullish (close higher than open)
- Short signals require the current candle to be bearish (close lower than open)
For risk management, the strategy employs ATR-based dynamic stop-loss and take-profit settings:
- Stop-loss: Entry price plus or minus 1.2 times the ATR value
- Take-profit: Entry price plus or minus 2.5 times the ATR value
This design ensures a risk-reward ratio of approximately 1:2.08, meeting the minimum 1:2 risk-reward ratio standard recommended by professional traders.
Strategy Advantages
-
Multiple Confirmation Mechanism: The combination of trend, momentum, volume, and candlestick pattern multi-layer filtering effectively reduces false signals and improves trade quality.
-
Strong Adaptability: By using the dynamic changes of EMA and RSI to adapt to different market states, rather than relying on fixed price thresholds, the strategy maintains stability across different volatility environments.
-
Volume Confirmation: Incorporating the volume analysis dimension ensures trading directions are supported by sufficient market participation, increasing trade reliability.
-
Dynamic Risk Management: ATR-based stop-loss and take-profit settings automatically adjust protection ranges based on actual market volatility, avoiding the inflexibility of fixed levels.
-
Directionally Neutral: The strategy includes both long and short trading rules, allowing it to capture opportunities in different market environments without being limited to one-directional markets.
-
Parameter Optimization Space: Core parameters (such as EMA period, RSI threshold, ATR multipliers) can be adjusted according to different market characteristics, providing significant optimization flexibility.
Strategy Risks
-
Trend Reversal Risk: During sudden reversals of strong trends, the strategy may face significant drawdowns. Although EMA and RSI provide certain trend confirmation, the lag of these indicators may lead to delayed reactions during severe market fluctuations.
- Solution: Consider adding volatility filters or trend strength indicators to reduce trading frequency or increase stop-loss range during heightened market volatility.
-
Parameter Sensitivity: Strategy performance is sensitive to parameter choices such as EMA period, RSI threshold, and ATR multipliers. Inappropriate parameter settings may lead to overtrading or missing important opportunities.
- Solution: Conduct comprehensive parameter optimization and backtesting to determine optimal parameter combinations, and consider using different parameter configurations for different market environments.
-
False Breakout Risk: In consolidation zones or low-volatility environments, temporary breakouts followed by quick reversals may occur, leading to false signals.
- Solution: Consider adding confirmation periods or introducing volatility filtering mechanisms, requiring signals to persist for longer or only executing trades under specific volatility conditions.
-
Volume Anomalies: Under certain market conditions, volume may exhibit abnormal fluctuations (such as volume traps during false breakouts), leading to incorrect volume confirmation.
- Solution: Increase the depth of volume analysis, such as considering volume trends rather than single values, or analyzing volume quality in conjunction with price action.
-
Stop-Loss and Take-Profit Settings: Fixed ATR multipliers may perform inconsistently in different market environments; stops may be too wide during high volatility periods, while profit targets may be difficult to reach during low volatility periods.
- Solution: Consider dynamically adjusting ATR multipliers, adapting stop-loss and take-profit ranges based on market volatility states.
Strategy Optimization Directions
-
Introduce Adaptive Parameters:
- Transform fixed EMA and RSI parameters into volatility-based adaptive parameters, using longer periods in high-volatility environments to reduce noise, and shorter periods in low-volatility environments to increase sensitivity.
- Optimization rationale: Adaptive parameters can better accommodate different market phases, reduce subjectivity in parameter selection, and improve strategy robustness.
-
Enhance Trend Confirmation Mechanisms:
- Introduce trend strength indicators (such as ADX or Super Trend), only executing trades when trend strength exceeds specific thresholds.
- Optimization rationale: Simple EMA slope judgment may be insufficient for accurately assessing trend strength; additional trend confirmation can significantly reduce false signals in consolidation zones.
-
Integrate Multi-Timeframe Analysis:
- Add higher timeframe trend filters to the main trading timeframe, ensuring trade direction aligns with larger trends.
- Optimization rationale: Multi-timeframe analysis provides a more comprehensive market perspective, reducing the risk of counter-trend trading and improving win rates.
-
Optimize Volume Analysis:
- Upgrade simple volume comparisons to more complex volume pattern recognition, considering volume trends, distribution, or relative volume strength.
- Optimization rationale: Deeper volume analysis can more accurately assess market participation and momentum quality, reducing risks from volume traps.
-
Implement Machine Learning Optimization:
- Utilize machine learning algorithms to dynamically optimize trading parameters or predict signal quality, automatically adjusting trading decisions based on historical patterns.
- Optimization rationale: Machine learning can identify complex patterns and correlations difficult for humans to detect, improving strategy adaptability and prediction accuracy.
-
Improve Capital Management Plans:
- Dynamically adjust position sizes based on win rates, risk-reward ratios, and market conditions, increasing positions for high-confidence signals and reducing risk exposure under marginal conditions.
- Optimization rationale: Intelligent capital management can significantly impact long-term returns, enabling the strategy to achieve better compound returns while maintaining the same trading logic.
Summary
The Multi-Indicator Trend Following & Momentum Confirmation Trading Strategy integrates multiple dimensions of technical analysis (trend, momentum, volume, and candlestick patterns) to build a relatively comprehensive trading decision system. The core advantages of this strategy lie in its multi-level signal confirmation mechanism and adaptive risk management framework, allowing it to maintain adaptability across different market environments.
Nevertheless, the strategy still faces challenges including parameter sensitivity, trend reversal risk, and false breakouts. Through the introduction of adaptive parameter design, enhanced trend confirmation mechanisms, integration of multi-timeframe analysis, optimization of volume analysis methods, application of machine learning techniques, and improved capital management plans, the strategy has the potential to further improve trading performance and robustness while maintaining its original logical framework.
Ultimately, the success of any quantitative trading strategy depends on a deep understanding of its principles, reasonable parameter settings, and strict risk control. In practical applications, strategy parameters should be regularly evaluated and adjusted through historical backtesting and forward validation to adapt to constantly changing market environments.
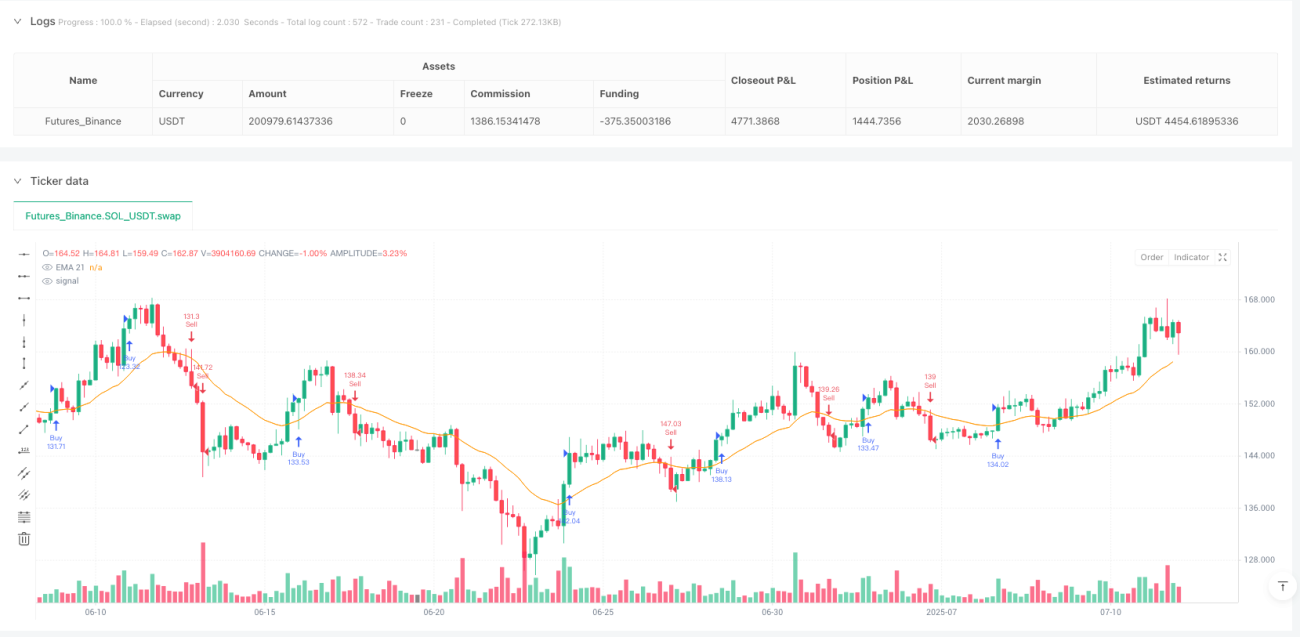
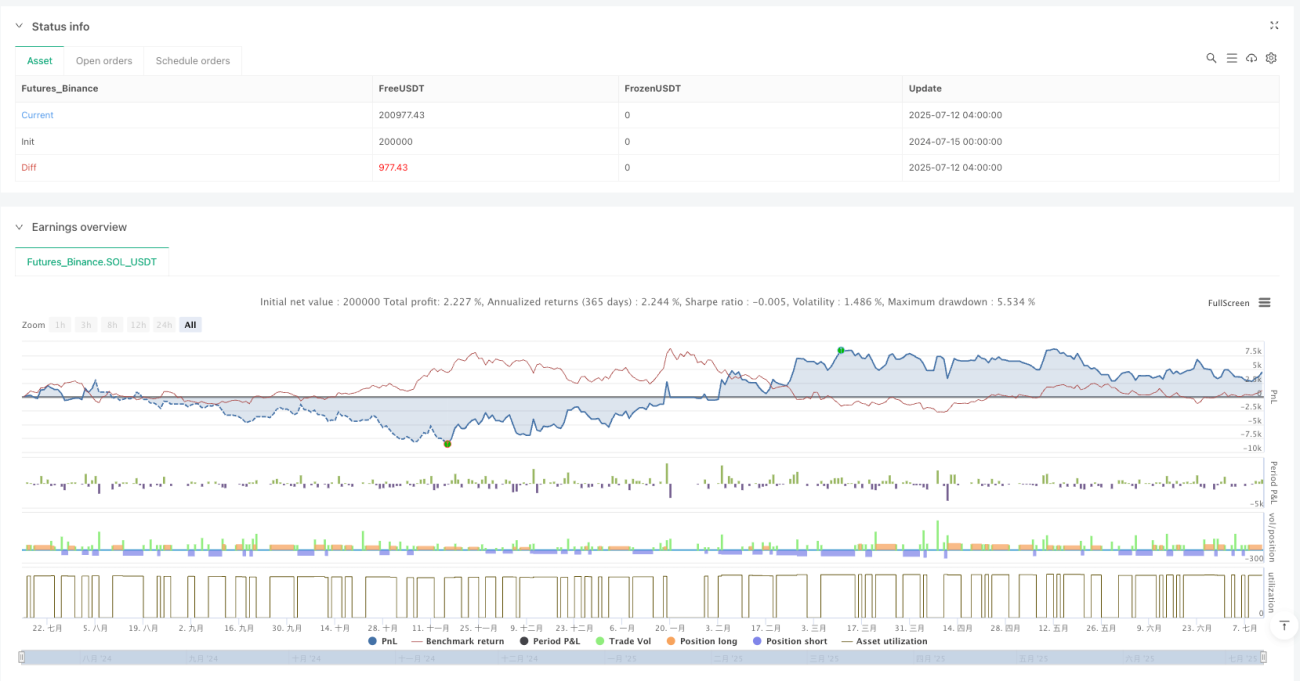
/*backtest
start: 2024-07-15 00:00:00
end: 2025-07-12 08:00:00
period: 4h
basePeriod: 4h
exchanges: [{"eid":"Futures_Binance","currency":"SOL_USDT","balance":200000}]
*/

//@version=5
strategy("High Win Rate XAUUSD Strategy (EMA21 + RSI + Volume MA20)", overlay=true, default_qty_type=strategy.percent_of_equity, default_qty_value=10)

// === Inputs ===- 1