
Overview
The Multi-Timeframe Indicator Trend Confirmation Trading Strategy is a high-precision quantitative trading system based on Smart Money Concepts (SMC), designed for traders seeking 3-5 high-probability trading opportunities per week. The strategy combines multi-timeframe market structure analysis, EMA50 trend direction filtering, orderblock area of interest identification, and break & retest entry confirmations to build a comprehensive trading decision framework. The strategy particularly focuses on market structure alignment at daily and weekly timeframes, prioritizing trading opportunities on 4-hour charts that conform to TOBO (Take Out Break Out) / OBO (Order Block Opportunity) formations, with entry validation through candlestick confirmation signals such as Engulfing patterns or Pin Bars.
Strategy Principles
Through in-depth code analysis, we can clearly see that the core principles of this strategy are built on a multi-layered confirmation mechanism:
-
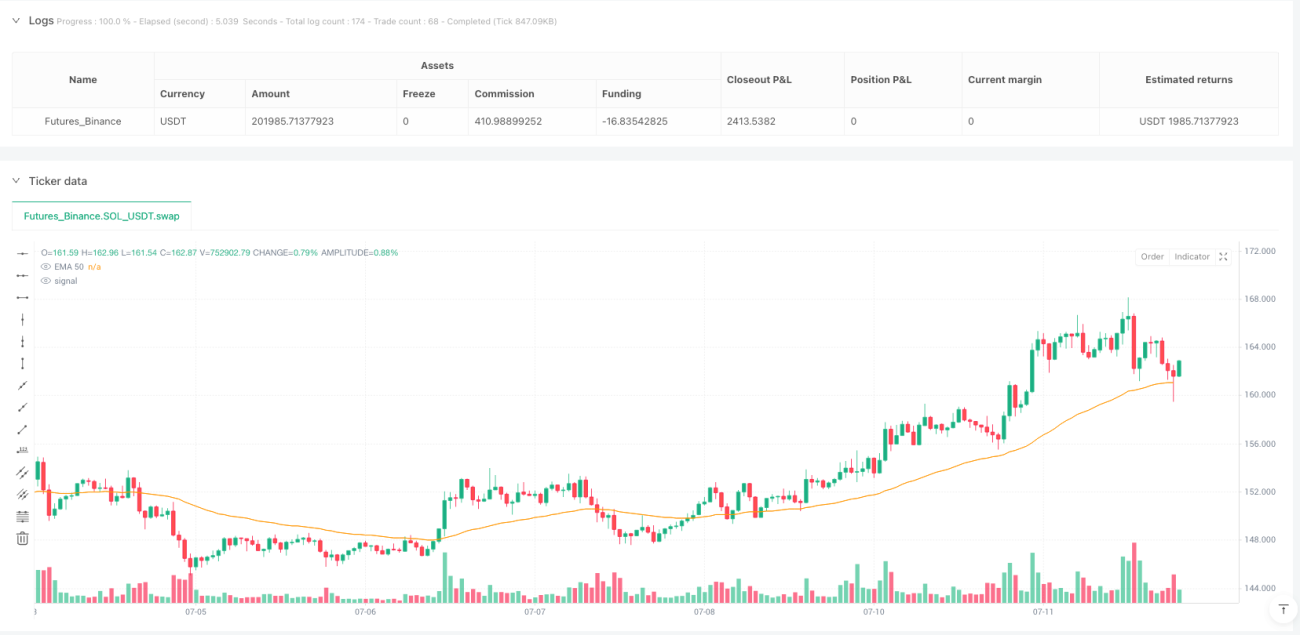
EMA50 Trend Filtering: The strategy uses a 50-period Exponential Moving Average (EMA50) as the primary trend identification tool, only considering long positions when price is above EMA50 and short positions when price is below EMA50.
-
Candlestick Pattern Confirmation: The strategy identifies two key reversal patterns:
- Engulfing Patterns: Identifying bullish and bearish engulfing patterns by comparing the current and previous candle's open and close prices
- Pin Bar Formations: Identifying bullish and bearish pin bars by calculating the ratio of upper/lower shadows to the candle body
-
Retest Confirmation Mechanism: Providing additional entry confirmation by detecting whether the price retests the EMA50, ensuring that the trading direction aligns with the current trend
-
Risk-Reward Ratio Setting: The strategy defaults to a 1:2.5 risk-reward ratio, meaning the potential gain is 2.5 times the potential risk, which helps maintain positive expectancy in long-term trading
-
Precise Entry and Exit Logic: The strategy automatically generates entry signals when all conditions are met and calculates stop-loss and take-profit levels based on the set risk-reward ratio
Strategy Advantages
This strategy has several significant advantages:
-
High-Probability Trading Signals: Through multiple confirmation mechanisms, it significantly improves the quality and win rate of trading signals, avoiding false breakouts and low-quality entries
-
Adaptability to Various Market Environments: The strategy can be applied to forex and major cryptocurrency markets, demonstrating strong versatility and adaptability
-
Clear Risk Management: The fixed risk-reward ratio (1:2.5) ensures that each trade has clear risk control and profit targets
-
Reduced Trading Frequency, Increased Quality: By generating only 3-5 trading signals per week, it allows traders to focus on high-quality trading opportunities and avoid overtrading
-
Combination of Trend Following and Reversal: Through EMA50 trend filtering and TOBO/OBO structure identification, it effectively combines the advantages of trend following and structural reversal strategies
-
Simplified Technical Indicators: Rather than relying on complex combinations of technical indicators, it focuses on market structure, trend, and price action, reducing the complexity of parameter optimization
-
Session Time Filtering: Considers market activity during London and New York trading sessions, executing trades during periods of optimal liquidity
Strategy Risks
Despite its numerous advantages, the strategy also presents some potential risks:
-
False Breakout Risk: Despite multiple confirmation mechanisms, the market may still experience false breakouts, triggering stop-losses. Solution: Consider adding volume confirmation or stricter entry conditions.
-
Rapid Trend Changes: Under the influence of strong market news or sudden events, EMA50 may lag behind actual market changes. Solution: Combine shorter-period moving averages or momentum indicators for auxiliary judgment.
-
Decreased Effectiveness in Low Volatility Environments: During periods of low market volatility, the strategy may struggle to generate sufficient trading signals. Solution: Consider reducing the strictness of entry conditions or adjusting to lower timeframes.
-
Limitations of Fixed Parameters: The fixed risk-reward ratio (2.5) may not be suitable for all market conditions. Solution: Dynamically adjust the risk-reward ratio based on the volatility characteristics of different markets.
-
Overly Simplistic Stop-Loss Setting: The current stop-loss is set 10 minimum price movement units below the low point, which may be insufficient to account for market noise. Solution: Calculate more reasonable stop-loss positions based on ATR or volatility.
Strategy Optimization Directions
Based on code analysis, the strategy can be optimized in the following directions:
-
Dynamic Risk-Reward Ratio: Automatically adjust the risk-reward ratio based on market volatility (e.g., using the ATR indicator), adopting more aggressive ratios in highly volatile markets and more conservative ratios in less volatile markets.
-
Volume Confirmation: Add volume breakout confirmation to entry conditions to improve signal quality, especially in identifying genuine breakouts.
-
Enhanced Multi-Timeframe Consistency: Explicitly code the logic for determining daily and weekly trends to ensure entries only occur when trends align across multiple timeframes.
-
Adaptive EMA Period: Dynamically adjust the EMA period based on market volatility, using shorter periods in highly volatile markets and longer periods in less volatile markets.
-
More Precise Market Structure Identification: Enhance the precise definition of price structures, such as the continuity of highs and lows, to improve the accuracy of TOBO and OBO pattern identification.
-
Market Environment Filtering: Introduce market environment assessment (trend, range, or chaos) and adopt different trading strategies for different market environments.
-
Improved Stop-Loss Mechanism: Set dynamic stop-losses based on ATR or historical volatility rather than fixed price movement units, better adapting to the volatility characteristics of different markets.
-
Retest Condition Optimization: The current retest conditions are relatively simple; assessment of retest depth and quality can be added, such as the relationship between retest depth and previous volatility.
Summary
The Multi-Timeframe Indicator Trend Confirmation Trading Strategy is a comprehensive trading system that integrates various technical analysis methods. By combining EMA trend filtering, price action confirmation, and market structure analysis, it provides traders with high-quality trading signals. The strategy particularly emphasizes trade quality over quantity, suitable for traders seeking a small number of high-probability trading opportunities each week.
The core strengths of the strategy lie in its multi-layered confirmation mechanism and clear risk management framework, but attention must be paid to potential risks arising from changing market environments and fixed parameters. By introducing dynamic parameter adjustments, strengthening multi-timeframe consistency analysis, and improving stop-loss mechanisms, the strategy has the potential to achieve more stable performance across different market environments.
Overall, this is a strategy based on solid trading principles, suitable for traders who understand technical analysis and market structure. With reasonable optimization and risk management, it can become an effective tool in a trader's toolkit, especially for finding high-probability reversal and trend continuation opportunities.
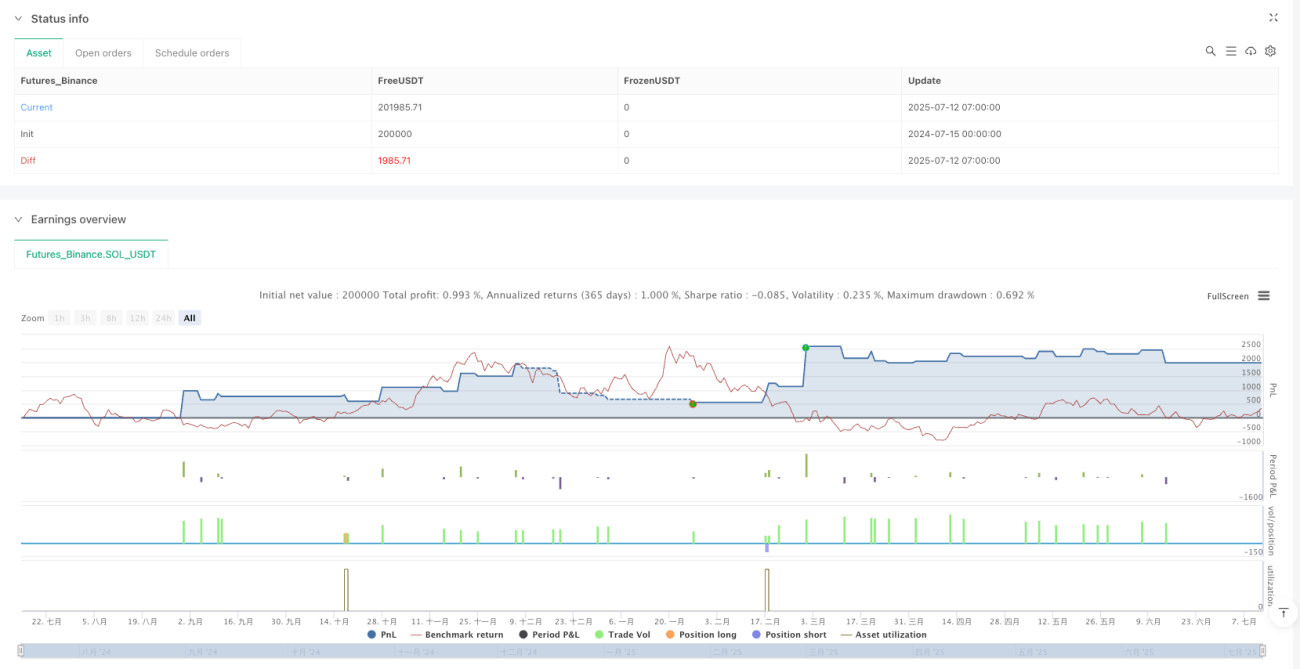
/*backtest
start: 2024-07-15 00:00:00
end: 2025-07-12 08:00:00
period: 1h
basePeriod: 1h
exchanges: [{"eid":"Futures_Binance","currency":"SOL_USDT","balance":200000}]
*/

//@version=5
strategy("ErgunFX Prime | RR 1:2.5", overlay=true, default_qty_type=strategy.percent_of_equity, default_qty_value=10)

// === Ayarlar ===- 1