
Overview
The QMC-QM-AO Divergence Multi-Timeframe Quantitative Trading Strategy is a technical analysis-based quantitative trading system that combines Quantitative Market Classification (QMC), Quantitative Movement (QM), and Awesome Oscillator (AO) divergence signals to identify potential trading opportunities. This strategy is specifically designed for H4 and H1 timeframes and applies a 1:3 risk-reward ratio, meaning the potential profit is three times the potential loss. The core concept is to capture market trend reversal points by identifying divergences between price highs/lows and momentum indicators, combined with breakout price patterns.
Strategy Principles
The strategy operates based on three main components:
-
Awesome Oscillator (AO): AO is a momentum indicator calculated as the difference between the 5-period and 34-period simple moving averages of the price midpoint (HL2). The strategy uses AO to identify changes in market momentum.
-
Quantitative Movement (QM) Level Detection: The strategy uses 5-bar pivot highs and lows to identify key price levels. QM signals are generated when:
- Bullish QM signal: When a pivot low forms and the current close is higher than the previous bar's high
- Bearish QM signal: When a pivot high forms and the current close is lower than the previous bar's low
-
AO Divergence Detection:
- Bullish divergence: When price makes a lower low but the AO indicator makes a higher low
- Bearish divergence: When price makes a higher high but the AO indicator makes a lower high
Entry conditions are a combination of QM signals and AO divergence:
- Long entry: Bullish QM signal coincides with bullish AO divergence
- Short entry: Bearish QM signal coincides with bearish AO divergence
Stop-loss is set based on the QM level plus a buffer of 0.2 times ATR (Average True Range), while take-profit targets are set at 3 times the distance between entry price and stop-loss level, achieving a 1:3 risk-reward ratio.
Strategy Advantages
-
Multiple Confirmation Mechanism: The strategy combines price patterns (QMC and QM) with momentum indicators (AO), providing more reliable trading signals. Multiple confirmations reduce the risk of false signals and increase the success rate of trades.
-
Divergence Identification Capability: The strategy can identify divergences between price and momentum indicators, which are often strong signals that market trends are about to reverse. This ability to identify reversal points early allows traders to establish positions ahead of most market participants.
-
Optimized Risk Management: The 1:3 risk-reward ratio means that even with a win rate of only 30%, the strategy can still be profitable in the long run. This conservative risk management approach helps protect account capital.
-
Market Structure-Based Stop Loss: Stop-loss levels are set near key QM levels, which represent important support or resistance areas in market structure, rather than randomly chosen price points, enhancing the effectiveness of stop-loss placements.
-
Automated Trading Capability: The strategy is fully programmed and can execute trades automatically, reducing emotional interference and ensuring strict adherence to trading discipline.
Strategy Risks
-
False Divergence Signals: In range-bound markets, AO divergences might generate false signals, leading to unnecessary trading losses. Market noise can cause short-term divergences in indicators, but prices may not reverse as expected.
-
Extreme Market Volatility Risk: During major news releases or black swan events, prices may quickly break through stop-loss levels, resulting in losses greater than anticipated.
-
Parameter Sensitivity: The strategy uses fixed parameters (such as 5 and 34 period moving averages, 5-bar pivot points, 0.2 ATR buffer), which may need adjustment across different market environments or trading instruments.
-
Delayed Signal Risk: Due to the need for pivot point formation and divergence confirmation, trading signals may experience some delay, missing optimal entry points.
-
Money Management Issues: The strategy uses a fixed 10% account equity percentage for trading, which may not be suitable for all market conditions or account sizes.
Solutions:
- Incorporate additional filtering conditions, such as trend filters or volatility filters, to reduce false signals
- Implement dynamic position sizing, adjusting the equity percentage based on market volatility
- Pause strategy operation before major economic data releases
- Conduct extensive backtesting to find optimal parameter settings for different market environments
Strategy Optimization Directions
- Add Trend Filters: Introduce longer-term trend indicators (such as daily or weekly) and only trade in the direction of the larger trend. This can improve win rates, as trend-following trades are typically more successful than counter-trend trades. Consider adding code like:
longTermTrend = ta.sma(close, 200) > ta.sma(close, 200)[20]
longCond := longCond and longTermTrend
shortCond := shortCond and not longTermTrend
- Dynamic Stop-Loss and Risk Ratio: Adjust stop-loss distance and risk-reward ratio dynamically based on market volatility. In more volatile markets, wider stops and smaller risk-reward ratios might be needed. Use ATR multiples to set dynamic values:
            volMultiplier = ta.atr(14) / ta.atr(14)[20]
slDistance = atr * 0.2 * math.min(2, math.max(0.5, volMultiplier))
-
Add Trading Session Filters: Certain sessions (such as market opening or before/after important data releases) have higher volatility and may not be suitable for this strategy. Adding session filters can avoid trading during these high-risk periods.
-
Optimize Entry Timing: The current strategy enters on the first bar when a signal appears. Consider waiting for a pullback or confirmation bar before entering to get better entry prices.
-
Multi-Tier Take-Profit Strategy: Instead of setting a single take-profit target, consider a staged approach to taking profits, such as moving the stop-loss to breakeven at 1:1 risk-reward, closing part of the position at 1:2, and letting the remainder aim for higher returns.
These optimization directions aim to improve the strategy's stability and profitability, reduce the possibility of significant drawdowns, and better adapt to different market environments.
Summary
The QMC-QM-AO Divergence Multi-Timeframe Quantitative Trading Strategy is an advanced trading system that integrates price structure analysis and momentum indicators. By seeking resonance points between QM breakout patterns and AO divergences, the strategy aims to capture potential trend reversal opportunities. The 1:3 risk-reward setup reflects the strategy's conservative risk management philosophy, maintaining long-term profitability potential even with lower win rates.
The core advantages of this strategy lie in its multiple confirmation mechanisms and market structure-based stop-loss settings, though it also faces risks such as false signals and parameter sensitivity. Through the addition of trend filters, dynamic adjustment of risk parameters, and optimization of entry timing, there is significant room for improvement in this strategy.
For quantitative traders, this strategy provides a solid framework that can be further customized and optimized according to individual trading styles and risk preferences. Whether used as an independent trading system or as part of a larger strategy portfolio, this strategy demonstrates the effective application of technical analysis in quantitative trading.
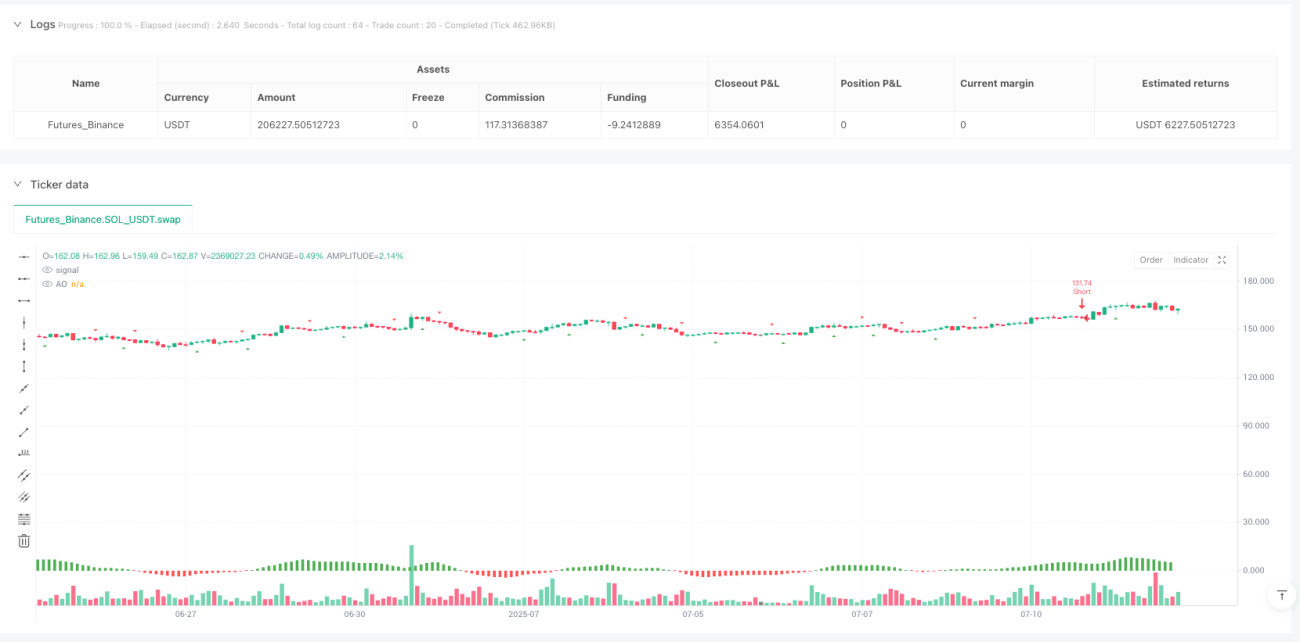
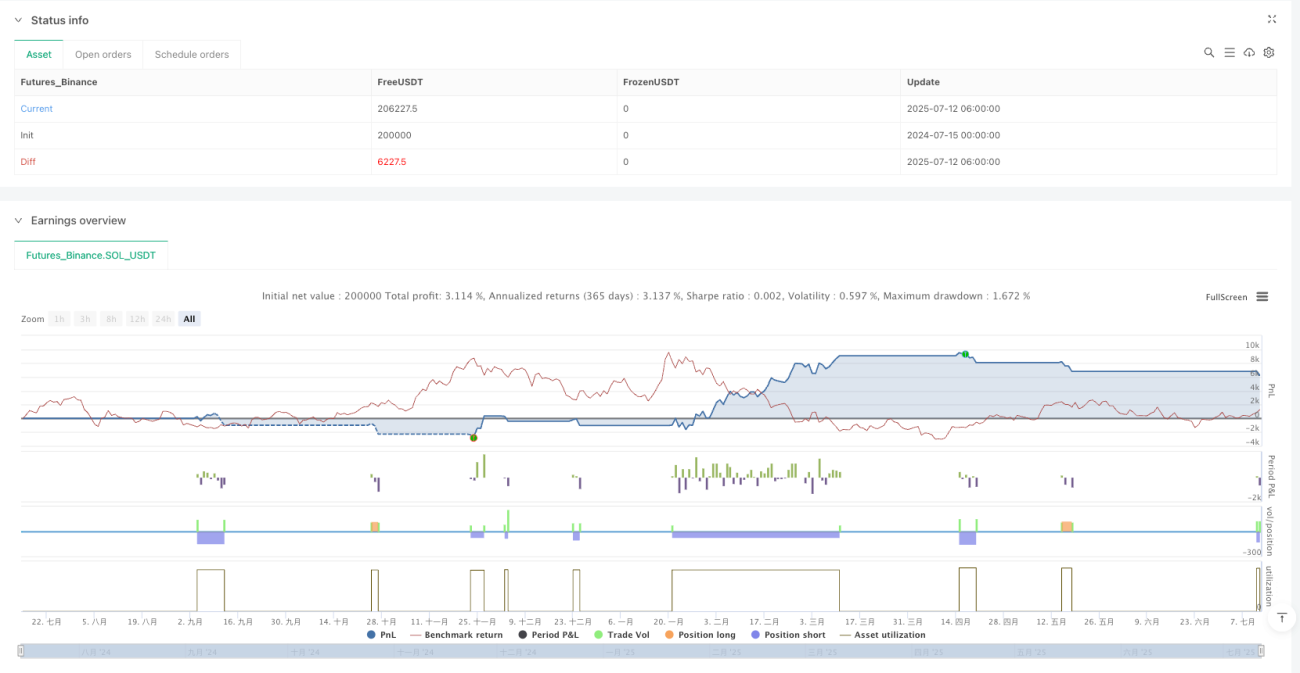
/*backtest
start: 2024-07-15 00:00:00
end: 2025-07-12 08:00:00
period: 2h
basePeriod: 2h
exchanges: [{"eid":"Futures_Binance","currency":"SOL_USDT","balance":200000}]
*/

//@version=5
strategy("QMC + QM + AO Divergence Strategy | 1:3 RR | H4-H1", overlay=true, default_qty_type=strategy.percent_of_equity, default_qty_value=10)

// === AO (Awesome Oscillator) ===- 1