
Overview
The Dynamic Threshold RSI with Dual EMA Crossover Strategy is a high-frequency trading system that combines overbought/oversold judgment with trend direction confirmation. This strategy utilizes more aggressive RSI thresholds (40/60 instead of the traditional 30/70), coupled with the crossover confirmation of fast and slow Exponential Moving Averages (EMA), to capture short-term opportunities in oscillating markets. The strategy incorporates built-in fixed percentage take-profit (1%) and stop-loss (0.5%) mechanisms, aiming to secure frequent small stable gains rather than pursuing large fluctuations. This strategy is particularly suitable for active traders who seek numerous trading signals in oscillating markets.
Strategy Principles
The core principles of this strategy are built on the combined use of two technical indicators: Relative Strength Index (RSI) and Exponential Moving Average (EMA).
-
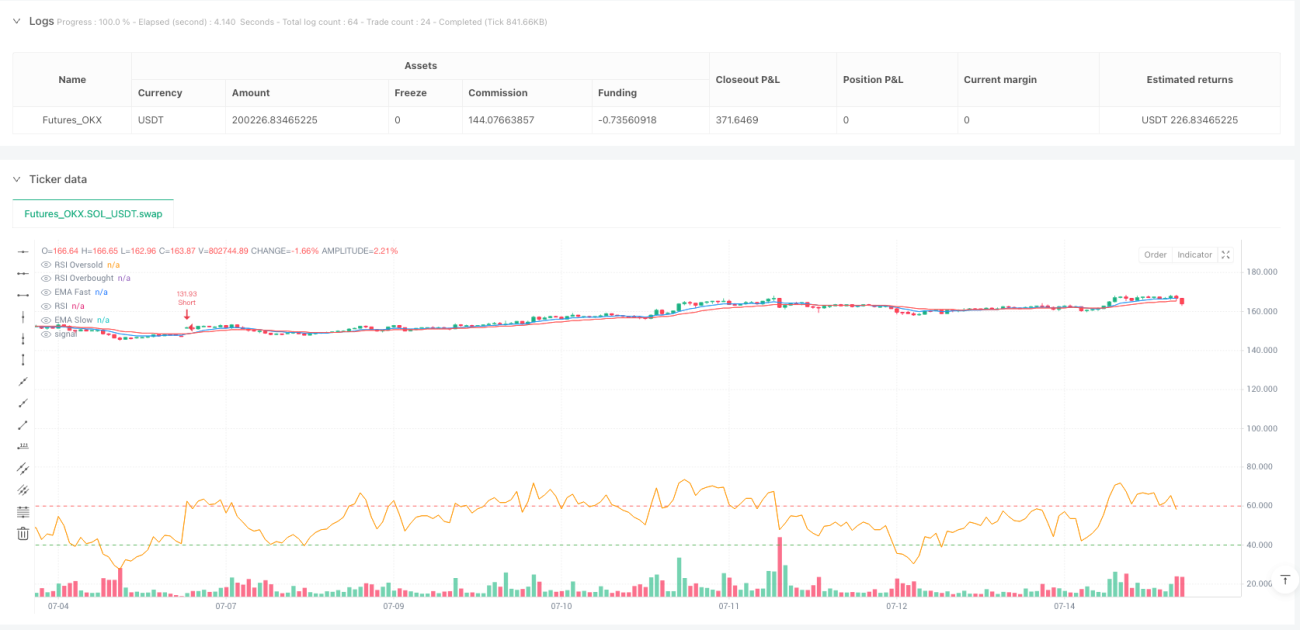
RSI Overbought/Oversold Detection: The strategy uses a 14-period RSI but adjusts the traditional 30/70 thresholds to more aggressive 40/60 levels. This means when RSI falls below 40, it's considered a potential oversold area, and when above 60, a potential overbought area. This adjustment increases trading frequency, allowing the strategy to capture more medium and small fluctuations.
-
Dual EMA Trend Confirmation: The strategy employs 9-period (fast line) and 21-period (slow line) EMAs to confirm short-term trend direction. When the fast line is above the slow line, it indicates an upward short-term trend; when the fast line is below the slow line, it indicates a downward short-term trend.
-
Combined Trading Conditions:
- Long condition: RSI < 40 (oversold) AND Fast EMA > Slow EMA (uptrend)
- Short condition: RSI > 60 (overbought) AND Fast EMA < Slow EMA (downtrend)
-
Automatic Take-Profit/Stop-Loss: The strategy automatically sets the following exit conditions upon entering a trade:
- Take-profit level: Entry price ±1% (long positions +1%, short positions -1%)
- Stop-loss level: Entry price ±0.5% (long positions -0.5%, short positions +0.5%)
This design ensures a risk-reward ratio of 1:2, meaning the potential gain for each trade is twice the potential loss.
Strategy Advantages
-
High-Frequency Trading Opportunities: By using more aggressive RSI thresholds (40/60 instead of the traditional 30/70), the strategy provides more trading signals and opportunities, suitable for traders who wish to frequently participate in the market.
-
Dual Confirmation Mechanism: Combining RSI overbought/oversold indicators with EMA trend direction confirmation reduces the risk of false signals and improves trading accuracy.
-
Fixed Risk Management: The built-in take-profit/stop-loss mechanism ensures that the risk of each trade is strictly controlled, with stop-loss set at 0.5% and take-profit at 1%, forming a 2:1 reward-to-risk ratio.
-
High Adaptability: The strategy's parameters can be adjusted according to different market conditions and personal risk preferences, such as modifying RSI thresholds, EMA lengths, or take-profit/stop-loss percentages.
-
Visual Clarity: The strategy plots the RSI indicator, overbought/oversold level lines, and two EMA lines on the chart, allowing traders to intuitively understand market conditions and strategy logic.
-
Automated Trading: The strategy is fully automated, including entry, exit, and risk management, reducing emotional interference and improving execution discipline.
-
Alert Functionality: Built-in alert conditions enable traders to receive trading signal notifications promptly without needing to continuously monitor the charts.
Strategy Risks
-
Cost Risk from Frequent Trading: High-frequency trading strategies generate numerous trades, potentially leading to significant trading costs (spreads, commissions, etc.) that may erode the overall profitability of the strategy. It's recommended to conduct a thorough analysis of trading costs before live implementation.
-
Dependence on Oscillating Markets: This strategy performs best in oscillating markets but may generate frequent losing trades in strong trending markets. Particularly when the market exhibits continuous unidirectional movement, the strategy may repeatedly enter counter-trend trades.
-
Limitations of Fixed Take-Profit/Stop-Loss: Using fixed percentage take-profit/stop-loss may not adapt to the volatility of different markets. In low-volatility markets, the 1% take-profit might be difficult to reach; in high-volatility markets, the 0.5% stop-loss might be too tight.
-
Parameter Sensitivity: Strategy performance is highly sensitive to parameters such as RSI period, EMA length, and overbought/oversold thresholds. Inappropriate parameter settings may lead to overtrading or missing important opportunities.
-
Slippage Risk: In fast-moving markets, due to instantaneous price changes, actual entry and exit prices may differ significantly from ideal prices, affecting the actual performance of the strategy.
Strategy Optimization Directions
-
Dynamic RSI Thresholds: The current strategy uses fixed RSI thresholds (40/60). Consider implementing adaptive RSI thresholds that automatically adjust based on historical volatility. For example, using wider thresholds (like 35/65) in more volatile markets and narrower thresholds (like 45/55) in less volatile markets.
-
ATR Dynamic Stop-Loss: Replace fixed percentage stop-loss with Average True Range (ATR) to better adapt stop-loss points to current market volatility. For instance, set stop-loss at entry price minus 1.5 times the current ATR.
-
Trading Time Filter: Add time filters to avoid trading during high-volatility periods near market opening and closing, or to avoid low-liquidity periods. This can be implemented by checking if the current trading session is within a predefined active time range.
-
Volume Confirmation: Add volume analysis as an additional confirmation indicator. Execute trading signals only when accompanied by increased volume, which can enhance trade reliability.
-
Trend Strength Filter: Add the Average Directional Index (ADX) indicator to measure trend strength, executing trades only when ADX is below a specific threshold (indicating an oscillating market), avoiding frequent counter-trend trading in strong trending markets.
-
Dynamic Position Management: Dynamically adjust trading position size based on market volatility, account size, and recent strategy performance, rather than consistently using 10% of account value.
-
Drawdown Control Mechanism: Add daily or weekly maximum drawdown limits; once the preset drawdown limit is reached, the strategy automatically stops trading for a period or reduces position size.
Summary
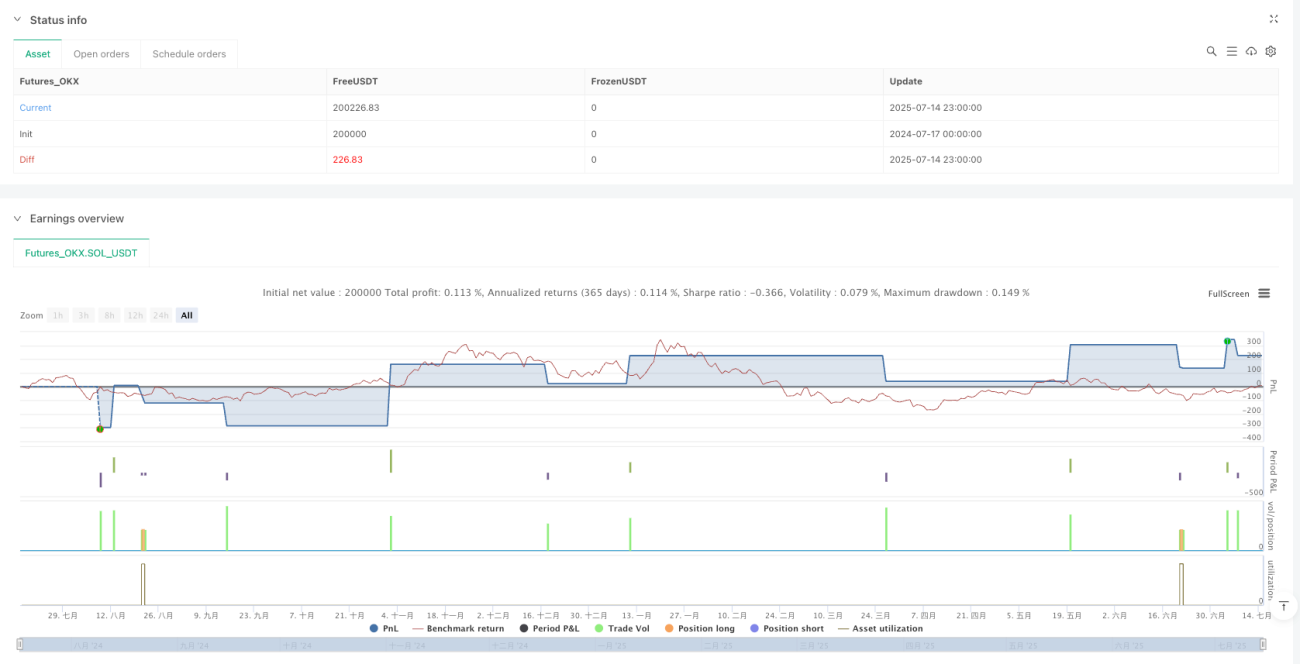
The Dynamic Threshold RSI with Dual EMA Crossover Strategy is a high-frequency trading system designed for oscillating markets, capturing short-term market fluctuations by combining RSI overbought/oversold signals with EMA trend confirmation. The strategy's main features include using more aggressive RSI thresholds (40/60), coupled with 9/21 period EMA crossovers, and implementing strict risk management (1% take-profit, 0.5% stop-loss).
This strategy is particularly suitable for active traders and oscillating market environments, accumulating profits through frequent small stable gains. However, when using this strategy, attention needs to be paid to trading costs, market environment adaptability, and parameter optimization.
By implementing the suggested optimization measures, such as dynamic RSI thresholds, ATR dynamic stop-loss, and trading time filters, the robustness and adaptability of the strategy can be further enhanced. Most importantly, traders should conduct thorough backtesting and simulated trading before live implementation, ensuring that the strategy's performance meets expectations under various market conditions.
/*backtest
start: 2024-07-17 00:00:00
end: 2025-07-15 00:00:00
period: 1h
basePeriod: 1h
exchanges: [{"eid":"Futures_OKX","currency":"SOL_USDT","balance":200000}]
*/

//@version=5
strategy("Aggressive RSI + EMA Strategy with TP/SL", overlay=true, default_qty_type=strategy.percent_of_equity, default_qty_value=10)

// Inputs- 1