
Overview
The Dynamic Trend Identification Strategy Based on Adaptive Moving Average and Average True Range Trailing Stop is an advanced quantitative trading system that combines ATR trailing stop and KAMA filter (XMA version). The core of this strategy lies in its two-step trend confirmation mechanism: first, it determines whether the market is in a bullish or bearish phase through the ATR trailing stop, then provides additional trend confirmation through the KAMA filter, effectively reducing false signals. This combination enables the strategy to precisely capture market trends while dynamically adapting to changes in market volatility, providing reliable entry signals for medium to long-term trend-following traders.
Strategy Principle
The operation of this strategy is based on the synergistic effect of two main components:
-
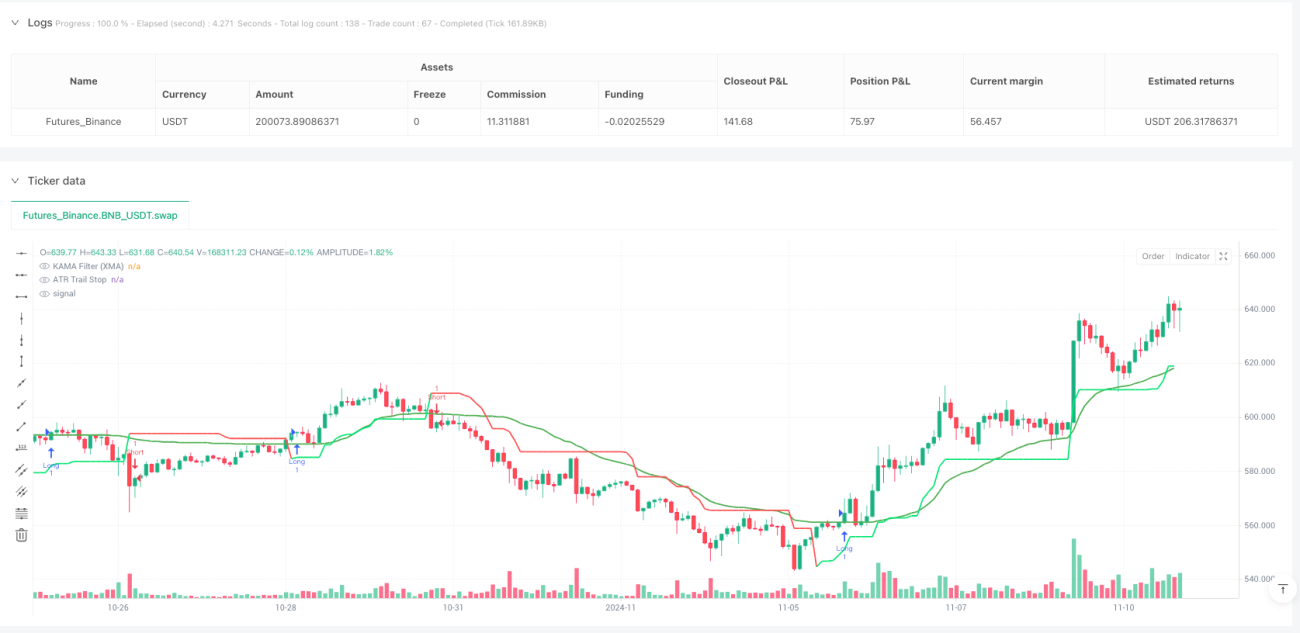
ATR Trailing Stop: Based on the Average True Range (ATR) indicator, this component automatically adapts to market volatility. By calculating the ATR and applying a multiplier (default 2.7), the strategy generates a dynamically adjusting trailing stop line. When the price is above this line, the market is considered bullish; otherwise, it is considered bearish. The calculation formula of the trailing stop line ensures it moves with price in the trend direction while remaining unchanged during counter moves, forming a natural stop-loss position.
-
KAMA Filter (XMA version): Kaufman Adaptive Moving Average (KAMA) provides additional trend confirmation. Unlike traditional KAMA, this XMA version avoids using fixed fast/slow parameters and instead dynamically calculates the ratio of signal to market "noise". Specifically, it works through the following steps:
- Calculate the absolute difference between the current price and the price n periods ago as the "signal"
- Calculate the cumulative absolute value of consecutive price changes over n periods as "noise"
- Calculate the efficiency ratio (signal/noise) and convert it to a smoothing factor
- Update the KAMA value using the smoothing factor
Entry signals are generated based on the following rules:
- Long Signal: Price is simultaneously above both the ATR trailing stop line and the KAMA line
- Short Signal: Price is simultaneously below both the ATR trailing stop line and the KAMA line
This dual confirmation mechanism ensures that trading signals are only generated when the trend is clear, significantly improving the reliability of signals.
Strategy Advantages
After analyzing the code, the strategy demonstrates multiple advantages:
-
Strong Adaptability: Unlike traditional strategies that rely on simple moving averages, this system uses an adaptive KAMA filter that responds better to changing market conditions and volatility. The ATR trailing stop line also automatically adjusts to current market volatility, providing an additional layer of protection against false breakouts.
-
Reduced Noise Interference: By combining two adaptive indicators, ATR and KAMA, the strategy effectively filters market noise, reducing false signals in choppy markets. Particularly, the efficiency ratio calculation of KAMA allows the indicator to react quickly when trends are obvious and remain stable in oscillating markets.
-
Multi-market Applicability: The strategy design is applicable to various markets (forex, stocks, cryptocurrencies, indices, etc.), offering a wide range of application scenarios.
-
Parameter Adjustability: Users can adjust ATR and KAMA parameters according to their trading plan, flexibly adapting to different market environments and personal risk preferences.
-
Compatibility with Smoothed Candlesticks: The strategy is fully compatible with smoothed candlestick charts (such as Heikin Ashi). By applying it to smoothed candlestick charts, it can further reduce market noise and enhance trend visualization.
Strategy Risks
Despite its many advantages, the strategy also has some potential risks:
-
Parameter Sensitivity: The choice of ATR multiplier and KAMA length parameters significantly impacts strategy performance. Improper parameter settings may lead to excessive lag (parameters too large) or excessive sensitivity (parameters too small). The solution is to optimize parameters through backtesting under different market conditions to find a balance point.
-
Trend Reversal Risk: Although the dual confirmation mechanism reduces false signals, it may also lead to slower reactions at the beginning of trend reversals, missing optimal entry points or delaying exits. To mitigate this risk, consider adding a short-term momentum indicator as an early warning system.
-
Performance in Ranging Markets: In sideways, choppy markets without clear trends, the strategy may produce frequent losing trades. It is recommended to evaluate the market environment before applying the strategy, or add a market structure recognition component to pause trading in sideways markets.
-
Overfitting Risk: There is a risk of overfitting historical data during the parameter optimization process, leading to poor future performance. Forward testing and out-of-sample testing are recommended to verify strategy robustness.
-
Technical Risk: The code uses a loop structure to calculate the noise component of KAMA, which may affect computational efficiency in high-frequency strategies or with large data volumes. Consider using more efficient cumulative summation methods to optimize performance.
Strategy Optimization Directions
Based on code analysis, the strategy has several potential optimization directions:
-
Dynamic Parameter Adjustment: Currently, the strategy uses fixed ATR period (10) and multiplier (2.7). Dynamic parameter adjustment based on market volatility or trend strength can be implemented. For example, increasing the ATR multiplier in high-volatility markets and decreasing it in low-volatility markets to adapt to different market environments.
-
Add Trend Strength Filtering: A trend strength indicator (such as ADX) can be added as an additional filter, generating signals only when trend strength exceeds a specific threshold, further reducing false signals in oscillating markets.
-
Optimize Exit Strategy: The current strategy focuses on entry signals but lacks a clear exit mechanism. ATR-based trailing stops or profit targets can be implemented, or reverse signals can be used as exit triggers to improve trade cycle management.
-
Market Environment Classification: Implement a market environment recognition component to distinguish between trending and ranging markets, and apply different parameters or even different strategy variants based on different market types.
-
Optimize KAMA Calculation: The current KAMA calculation uses a loop structure, which can be replaced with more efficient cumulative summation methods, such as the
ta.sum()function, to improve computational efficiency, especially with long-period parameters. -
Add Volume Filtering: Use volume as an additional confirmation factor, for example, confirming trend signals only when volume increases, avoiding false breakouts under low liquidity conditions.
Summary
The Dynamic Trend Identification Strategy Based on Adaptive Moving Average and Average True Range Trailing Stop is a carefully designed quantitative trading system that achieves precise identification and dynamic adaptation to market trends by combining ATR trailing stop and KAMA filter. The main advantages of the strategy lie in its adaptability and noise filtering capabilities, making it particularly suitable for medium to long-term trend-following traders.
The strategy adopts a dual confirmation mechanism, generating signals only when price simultaneously meets both ATR trend conditions and KAMA trend conditions, effectively reducing false signals. Additionally, the adaptive nature of the strategy enables it to maintain stable performance across different market environments, while the adjustability of parameters also provides room for personalized optimization.
Despite potential risks such as parameter sensitivity and performance in oscillating markets, these risks can be effectively managed through the suggested optimization directions, such as dynamic parameter adjustment, trend strength filtering, and market environment classification. In particular, the overall performance of the strategy is expected to be further enhanced by improving exit strategies and adding volume filtering.
Overall, this is a trend-following strategy with solid theoretical foundation and flexible implementation methods, offering high practical value for quantitative traders seeking reliable trend signals.
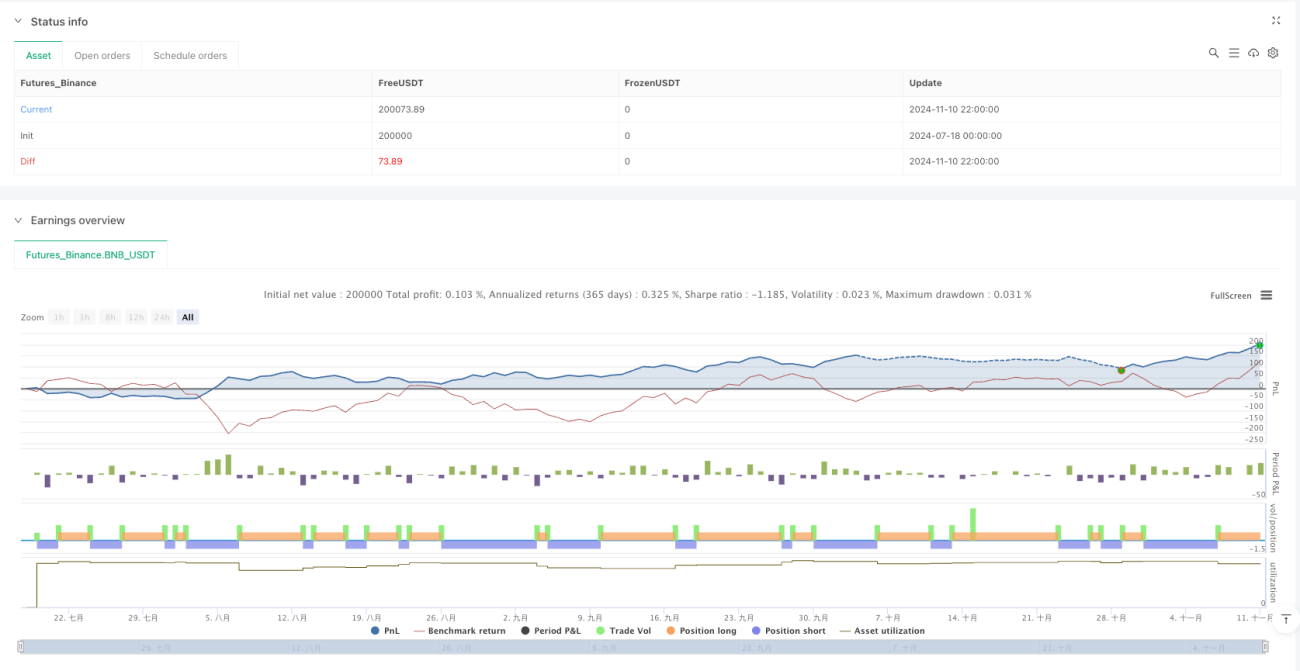
/*backtest
start: 2024-07-18 00:00:00
end: 2024-11-11 00:00:00
period: 2h
basePeriod: 2h
exchanges: [{"eid":"Futures_Binance","currency":"BNB_USDT","balance":200000}]
*/

// This Pine Script® code is subject to the terms of the Mozilla Public License 2.0 at https://mozilla.org/MPL/2.0/
// © Aleksin_Aleksandar

// ATR Trend Strategija sa uprošćenom KAMA (XMA KAMA verzija)- 1