
Overview
This strategy is a 1-hour timeframe trading system that combines higher timeframe trend confirmation, liquidity trap identification, MACD indicator alignment, and ATR-based risk management mechanisms. The strategy uses multi-timeframe analysis to confirm the overall market trend while utilizing price structure and liquidity zones to find high-probability entry points. It also includes a time filter that only triggers signals during specific trading hours and sets a clear risk-reward ratio to manage stop-loss and take-profit levels for each trade.
Strategy Principle
The core principle of this strategy is to ensure trade direction aligns with the main trend through multi-timeframe analysis. Specifically:
-
Higher Timeframe Trend Confirmation: The strategy uses the 4-hour timeframe's EMA200 and MACD indicators to determine the overall market trend. Long positions are only considered when price is above the 4-hour EMA200 and the MACD line is above its signal line; the opposite applies for shorts.
-
Local Momentum Confirmation: The 1-hour MACD indicator confirms the momentum direction in the current timeframe, ensuring consistency with the higher timeframe trend.
-
Liquidity Capture Mechanism: The strategy identifies two types of potential high-probability entry points:
- Price breakouts above recent highs (for longs) or below recent lows (for shorts)
- Liquidity grabs where price touches a recent low then rebounds (for longs) or touches a recent high then falls (for shorts)
-
ATR-Based Risk Management:
- Stop-loss levels are set as a multiple of ATR, automatically adapting to market volatility
- Take-profit levels are calculated based on a preset risk-reward ratio
- The strategy defaults to using 10% of account equity as position size
-
Time Filtering: The strategy only generates signals within user-defined trading hours, avoiding false signals during inactive periods.
Strategy Advantages
After deep analysis of the strategy code, we can summarize the following significant advantages:
-
Trend and Momentum Confluence: By confirming through multi-timeframe trend and momentum indicators, the reliability of trading signals is significantly improved. When the 4-hour and 1-hour indicators align in direction, the probability of successful trades increases substantially.
-
Intelligent Liquidity Detection: The strategy can identify liquidity traps and price structure changes in the market, which are often signs of institutional money activity. For example, when price drops to previous lows to attract sell orders and then quickly reverses, the strategy can capture this reversal opportunity.
-
Adaptive Risk Management: Using ATR to set stop-loss and take-profit levels allows risk management to automatically adjust according to market volatility, expanding stop-loss ranges when volatility increases and tightening them when volatility decreases.
-
Time Filter: By trading only during specific time periods, the strategy avoids interference from low liquidity or irregular volatility periods, focusing on the most active market sessions.
-
Fixed Risk-Reward Ratio: The preset risk-reward ratio ensures that the potential return for each trade is at least twice the risk, which favors positive growth in the equity curve over the long term.
Strategy Risks
Despite its well-designed structure, the strategy still has several risks that need attention:
-
False Breakout Risk: The market may exhibit false breakouts or reversals, leading the strategy into incorrect trades. A solution is to consider adding confirmation filters, such as volume confirmation or price retests.
-
Over-reliance on MACD: The strategy uses MACD across multiple timeframes, but as a lagging indicator, MACD may generate delayed signals during volatile markets. Consider combining with more sensitive momentum indicators like RSI or stochastic oscillators.
-
Limitations of Fixed Risk-Reward Ratio: While a 2:1 risk-reward ratio is a reasonable starting point, it may not always be optimal under different market conditions. In strong trending markets, it might miss larger profits; in ranging markets, it might be difficult to reach targets.
-
Potential Issues with Time Filtering: Fixed trading hours might miss important opportunities outside trading sessions, or the optimal trading hours might change across different seasons and market environments.
-
Lack of Volume Analysis: The current strategy does not consider volume factors, which are often important indicators for confirming price breakouts and reversals.
Strategy Optimization Directions
Based on deep analysis of the code, here are several possible optimization directions:
-
Dynamic Risk-Reward Ratio: Automatically adjust the risk-reward ratio based on market volatility state or trend strength. For example, use higher risk-reward ratios (such as 3:1 or 4:1) in strong trending markets, and more conservative ratios (such as 1.5:1) in ranging markets.
-
Add Volume Filters: Incorporate volume confirmation in entry conditions, executing trades only when breakouts or liquidity grabs are accompanied by significant volume increases.
-
Introduce Trend Strength Assessment: Implement trend strength indicators like ADX, entering more aggressively in strong trend environments and more conservatively in weak trend environments.
-
Dynamic Time Filtering: Based on historical data analysis, automatically adjust optimal trading hours for different market phases or seasons, rather than using fixed time ranges.
-
Partial Profit-Taking Mechanism: Implement a staged profit-taking strategy, such as moving the stop-loss to breakeven after achieving a 1:1 risk-reward ratio, allowing partial positions to continue running to capture larger movements.
-
Market State Adaptation: Add market environment recognition mechanisms to automatically adjust strategy parameters or pause trading during high volatility or specific market patterns.
Summary
The Multi-Timeframe Momentum Confluence Strategy with Liquidity Detection and ATR-Based Risk Management is a well-designed quantitative trading strategy that ensures trade direction aligns with the main trend through multi-timeframe analysis, uses liquidity capture and price structure to find high-probability entry points, and employs an ATR-based adaptive risk management system.
The core advantages of the strategy lie in its multi-layer confirmation of trend and momentum, intelligent liquidity detection mechanism, and adaptive risk management system. However, like any trading strategy, it also faces risks such as false breakouts, indicator lag, and limitations of fixed parameters.
By introducing optimizations such as dynamic risk-reward ratios, volume filtering, trend strength assessment, and partial profit-taking mechanisms, this strategy has the potential to further improve its performance and adaptability. For traders seeking to capture high-probability trading opportunities in volatile markets while maintaining reasonable risk control, this is a quantitative trading system worth considering.
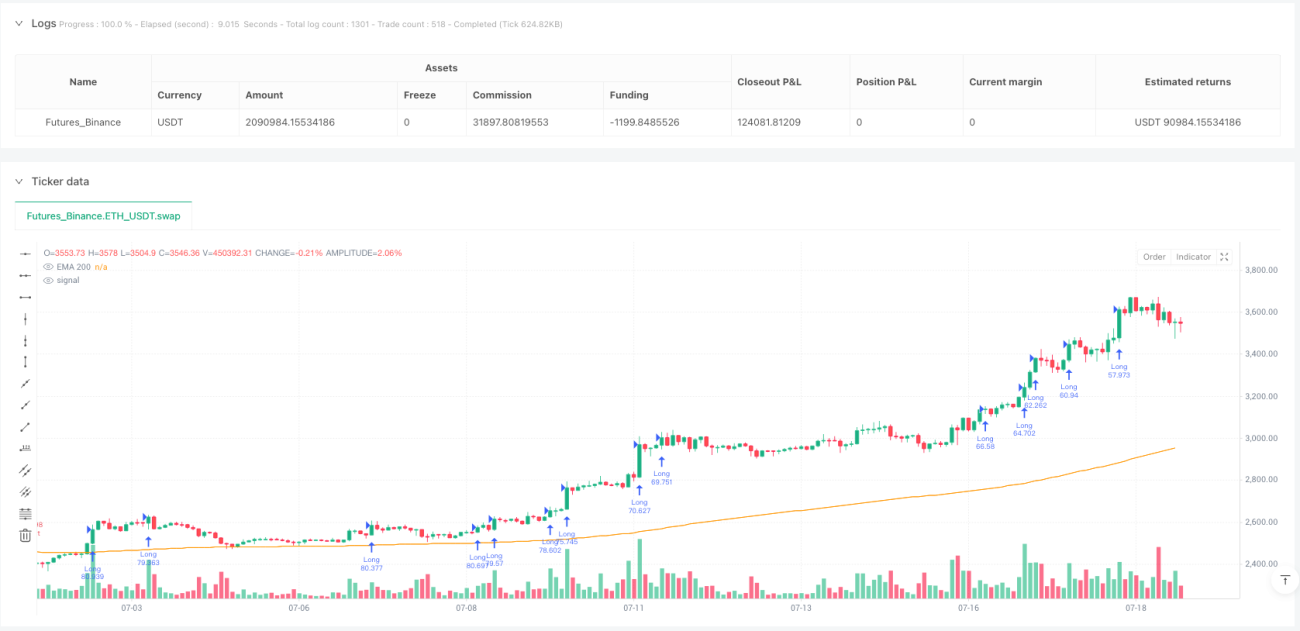
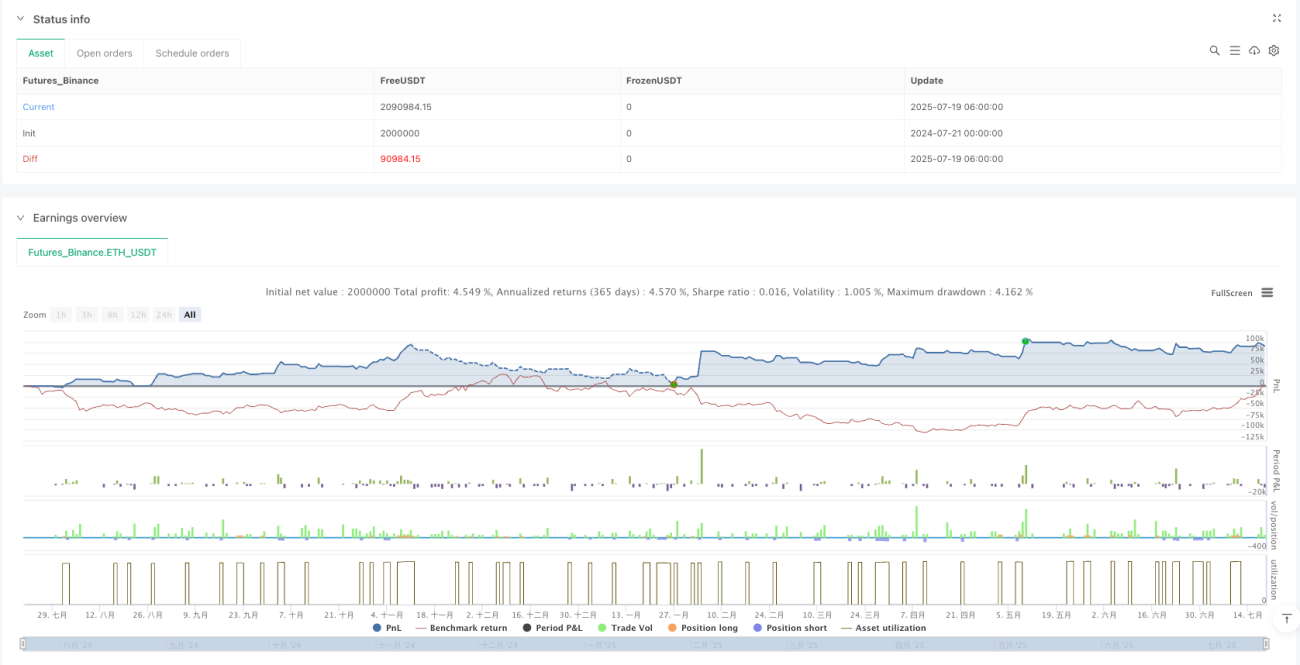
/*backtest
start: 2024-07-21 00:00:00
end: 2025-07-19 08:00:00
period: 2h
basePeriod: 2h
exchanges: [{"eid":"Futures_Binance","currency":"ETH_USDT","balance":2000000}]
*/

// MNQ 1H Trading Bot with Liquidity Grab, MACD, EMA200 and ATR R:R Filter (Version 6)
//@version=5
strategy("MNQ 1H Liquidity + MTF Bot", overlay=true, default_qty_type=strategy.percent_of_equity, default_qty_value=10)
- 1