Multi-Indicator Trend Confirmation with Dynamic Risk Management Trading System

Overview
The Multi-Indicator Trend Confirmation with Dynamic Risk Management Trading System is a comprehensive trading strategy based on multiple technical indicators, designed to capture high-probability trading opportunities by confirming trend signals from multiple perspectives. This strategy combines Exponential Moving Averages (EMAs), the Supertrend indicator, and candlestick pattern analysis, along with time filtering and dynamic risk management mechanisms, providing traders with a systematic trading framework. The strategy focuses on identifying trend direction through multiple confirmation signals during the London trading session, while utilizing key support and resistance levels to set dynamic stop-losses and profit targets, achieving risk-controlled trade execution.
Strategy Principles
The core principle of this strategy is to identify high-probability trend trading opportunities through multi-layered technical indicator confirmations, including several key components:
-
Multiple EMA Trend Confirmation: The strategy uses four different period Exponential Moving Averages (5, 34, 89, and 355 periods) to confirm price trends. Buy conditions require EMAs to show a clear bullish alignment (EMA5 > EMA34 > EMA89) with price above EMA355; sell conditions require a bearish alignment (EMA5 < EMA34 < EMA89) with price below EMA355.
-
Supertrend Indicator Confirmation: As a secondary confirmation of trend direction, the strategy incorporates the Supertrend indicator with ATR(10) and multiplier 3.0, requiring its direction to align with the EMA trend.
-
Engulfing Pattern Confirmation: The strategy requires an engulfing pattern in the direction of the trend as an entry trigger signal, with bullish engulfing patterns for buy conditions and bearish engulfing patterns for sell conditions.
-
London Session Filtering: The strategy only executes trades during the London trading session (UTC 07:00-16:00) to ensure adequate market liquidity.
-
Dynamic Risk Management: The strategy uses 5-period pivot highs and lows to determine stop-loss placement, sets a 2:1 risk-reward ratio for profit targets, and implements trailing stops to lock in profits.
-
Money Management Rules: Each trade risk is controlled at 1% of account equity, with dynamic position sizing to achieve consistent risk exposure.
The trading logic flow is as follows: When price is within the London trading session and meets all technical indicator conditions (EMA trend alignment, price relationship with EMA355, Supertrend direction) as well as the trigger signal (engulfing pattern), the strategy issues a buy or sell signal and sets stop-loss and profit targets based on recent pivot points.
Strategy Advantages
-
Multiple Confirmation Mechanism: This strategy requires multiple independent technical indicators to confirm simultaneously, greatly reducing the possibility of false signals. The triple confirmation of EMA trend alignment, Supertrend direction, and engulfing patterns increases the reliability of trading signals.
-
Trend and Momentum Combination: The strategy considers both long-term trends (via EMA355) and short-term momentum (via EMA5, 34, 89 alignment and engulfing patterns), effectively balancing trend following and timely entry needs.
-
Dynamic Risk Management: By dynamically setting stop-losses based on pivot points rather than using fixed points or percentages, the stop-loss placement better aligns with market structure and actual volatility conditions.
-
Adaptive Profit Targets: Setting profit targets based on a 2:1 risk-reward ratio according to actual market volatility, combined with a trailing stop mechanism, ensures sufficient profit potential while locking in gains during market reversals.
-
Time Filtering Optimization: By restricting trading to the London session, the strategy avoids slippage and abnormal volatility that may occur during low liquidity periods, improving trade execution quality.
-
Intuitive Market Status Monitoring: The strategy provides a comprehensive dashboard that displays the status of various trading conditions in real-time, helping traders quickly assess current market conditions and potential trading opportunities.
-
Fixed Risk Exposure: By controlling each trade risk at 1% of account equity, the strategy achieves consistent money management, avoiding overtrading and risk concentration.
Strategy Risks
-
Reduced Trading Frequency Due to Multiple Conditions: Since the strategy requires multiple conditions to be met simultaneously, it may result in relatively fewer trading signals, potentially missing some profitable opportunities in certain market environments. A solution is to consider dynamically adjusting the strictness of signal confirmation based on different market conditions.
-
Lag During Trend Reversals: EMA indicators are inherently lagging, especially the long-period EMA355, which may not respond timely during rapid trend reversals, leading to stop-losses being triggered or profit retracement. A solution is to incorporate volatility indicators to dynamically adjust stop-loss distances, or add trend strength filters.
-
Fixed Time Period Limitations: Trading only during the London session may miss important market opportunities in other sessions, especially when major economic data is released or market events occur. Consider adding exception rules for specific market events.
-
Pivot Point Dependency: In markets with low volatility, pivot points may not be clearly defined or may be distant from the current price, resulting in stop-loss distances that are too large or too small. Consider setting maximum and minimum stop-loss distance limits, or dynamically adjusting based on ATR.
-
Reliability of Engulfing Patterns: In certain market conditions, especially in low-volatility or highly oscillating markets, engulfing patterns may generate more false signals. Consider adding additional pattern confirmation conditions, such as volume confirmation or pattern size filtering.
-
Fixed 2:1 Risk-Reward Ratio: The optimal risk-reward ratio may vary in different market environments, and a fixed 2:1 setting may not always be the best choice. Consider dynamically adjusting target ratios based on historical volatility and market structure.
-
Trailing Stop Sensitivity: Overly sensitive trailing stops may trigger exits during minor price retracements, while insufficiently sensitive ones may result in excessive profit give-back. Consider dynamically adjusting trailing distances based on market volatility.
Strategy Optimization Directions
-
Adaptive Parameter Adjustment: Parameters such as EMA periods and Supertrend multiplier can be dynamically adjusted based on market volatility (such as ATR values) to better adapt to different market environments. This optimization is necessary because fixed parameters perform differently in various volatility environments, and adaptive parameters can improve strategy robustness.
-
Add Trend Strength Filters: Introduce trend strength indicators such as ADX (Average Directional Index), only executing trades when trend strength reaches a certain threshold to avoid frequent trading in ranging markets. This optimization can effectively reduce false signals in oscillating markets.
-
Optimize Time Filtering Mechanism: In addition to the London trading session, consider adding trading rules for New York and Asian trading sessions, or designing different parameter settings for different sessions to capture trading opportunities throughout the day. This can increase trading frequency and leverage market characteristics of different sessions.
-
Introduce Volatility Prediction: Through volatility cones or historical volatility analysis, predict potential future volatility ranges and dynamically adjust stop-loss distances and profit targets accordingly, making risk management more precise. This optimization is particularly effective for adapting to changing market states.
-
Integrate Market Sentiment Indicators: Incorporate oscillators such as RSI, CCI, or market breadth indicators to add a market sentiment dimension to the multiple confirmation system, enhancing the comprehensiveness of trading decisions. Market sentiment often leads price movements and can provide early warning signals.
-
Dynamic Money Management: Based on the strategy's historical performance, current consecutive profit/loss situation, and market volatility state, dynamically adjust the risk percentage for each trade, moderately increasing risk during good performance and reducing risk exposure during poor performance. This approach can optimize long-term capital growth curves.
-
Trade Timing Optimization: Add a trade timing scoring system that evaluates each potential signal based on multiple factors (such as trend strength, distance to support/resistance, volatility, etc.), only executing high-scoring signal trades to improve trading quality. This optimization can significantly improve the strategy's win rate and expected returns.
-
Add Multi-Timeframe Analysis: Integrate higher timeframe (such as daily or weekly) trend directions as additional filtering conditions to ensure trading direction aligns with larger trends, reducing counter-trend trading risks. Multi-timeframe coordination can significantly improve trading success rates.
Summary
The Multi-Indicator Trend Confirmation with Dynamic Risk Management Trading System is a comprehensive technical trading strategy that provides traders with a systematic, disciplined trading framework through multiple confirmation mechanisms including EMA trend alignment, Supertrend indicator, and engulfing patterns, combined with London session filtering and pivot-point-based dynamic risk management.
The core advantages of this strategy lie in its multi-layered signal confirmation mechanism and risk management system closely integrated with market structure, which can effectively filter noise, identify high-probability trading opportunities, and achieve risk-controlled trade execution through dynamic stop-loss and profit target settings. Meanwhile, the strategy's dashboard design provides intuitive market status monitoring, helping traders make more informed decisions.
However, the strategy also has potential risks such as lower trading frequency, signal lag, and dependence on specific market conditions. By introducing adaptive parameter adjustments, trend strength filtering, optimizing time frames, integrating market sentiment indicators, and implementing dynamic money management, the strategy's robustness and adaptability can be further improved to maintain good performance across different market environments.
Overall, this is a well-designed, logically clear trading strategy suitable for traders with a certain technical analysis foundation. Through appropriate backtesting, optimization, and personalization, this strategy has the potential to become a reliable trading tool, helping traders capture market opportunities while controlling risks.
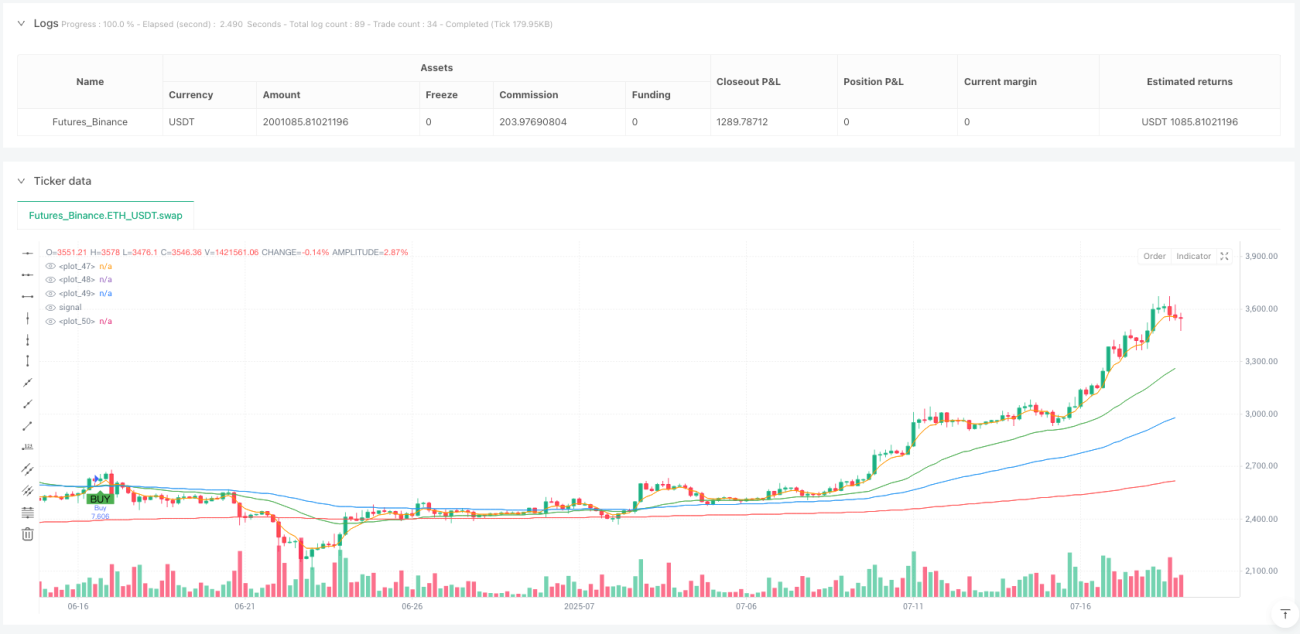
/*backtest
start: 2024-07-21 00:00:00
end: 2025-07-19 08:00:00
period: 4h
basePeriod: 4h
exchanges: [{"eid":"Futures_Binance","currency":"ETH_USDT","balance":2000000}]
*/

//@version=5
strategy("4H Gold & FX Bot - EMA + Supertrend + Engulfing", overlay=true, default_qty_type=strategy.percent_of_equity, default_qty_value=1)

// EMA Settings- 1