Multi-Timeframe Trend-Filtered Momentum Breakout Trading Strategy

Overview
The Multi-Timeframe Trend-Filtered Momentum Breakout Trading Strategy is a quantitative trading system that combines multi-timeframe analysis with momentum breakout principles. The strategy identifies breakout opportunities on a 3-minute chart while using a 1-hour chart for trend confirmation, thereby increasing the probability of successful trades. The strategy employs intelligent position management, initially entering with 2 contracts, scaling out 1 contract after reaching an ATR-based profit target, and managing the remaining position with a trailing stop or timeout mechanism. This approach both secures partial profits early and lets winners run, fully leveraging market volatility.
Strategy Principles
The core principles of this strategy are based on two major trading concepts: "trend following" and "momentum breakout." The specific implementation logic is as follows:
-
Multi-Timeframe Trend Filtering:
- Uses EMA(200) and MACD indicators on the 1-hour chart to determine the trend direction on the higher timeframe
- Only considers long entries when the 1-hour trend is up (price > EMA200 and MACD histogram > 0)
- Only considers short entries when the 1-hour trend is down (price < EMA200 and MACD histogram < 0)
-
Momentum Breakout Entry:
- On the 3-minute chart, enters long when price breaks above the highest high of the past 20 bars and the 1-hour trend is up
- On the 3-minute chart, enters short when price breaks below the lowest low of the past 20 bars and the 1-hour trend is down
- Each entry establishes a position of 2 contracts
-
Intelligent Position Management:
- Scaling-out mechanism: Closes half the position when price moves to reach a target set by the ATR multiplier (1.5x)
- Remaining position management: Uses a trailing stop (40 ticks) to continue holding and let profits run
- Timeout mechanism: Automatically closes the position if held for more than 30 3-minute bars (approximately 1.5 hours) to avoid prolonged consolidation
Strategy Advantages
-
Multi-Timeframe Synergy: By combining signals from 1-hour and 3-minute charts, the strategy effectively filters out low-quality trades, only seeking entry opportunities in the direction of the major trend, significantly improving win rate.
-
Intelligent Position Management: The scaling-out approach both secures partial profits when the price reaches the initial target and allows the remaining position to fully capture trends through trailing stops, implementing the trading philosophy of "letting profits run."
-
Adaptive Target Setting: Using the ATR indicator to adaptively set profit targets enables the strategy to automatically adjust based on market volatility, functioning effectively in both high-volatility and low-volatility environments.
-
Comprehensive Defense: Through dual protection of trailing stops and timeout mechanisms, the strategy effectively controls the maximum risk of a single trade, avoiding the possibility of being trapped or sustaining prolonged losses.
-
High-Frequency Precision: Using 3-minute charts for trading allows the capture of short-term market momentum, achieving more precise entries and exits, while maintaining a moderate trading frequency to avoid overtrading.
Strategy Risks
-
False Breakout Risk: The market may produce false breakouts, leading to immediate retracements after entry. The solution is to add confirmation indicators, such as volume confirmation or momentum divergence confirmation.
-
Trend Inflection Point Risk: Using historical trend indicators may lead to counter-trend trading when the main trend is about to change. It is recommended to add more sensitive trend reversal indicators, such as a dual EMA system or price structure analysis.
-
Over-reliance on Historical Trends: EMA(200) and MACD indicators are lagging indicators that may not be sensitive enough in rapidly changing markets. Consider adding some leading indicators as supplements.
-
Parameter Sensitivity: Strategy performance may be very sensitive to parameter settings (such as breakout lookback period, ATR multiplier, trailing stop ticks). Comprehensive parameter optimization and robustness testing are recommended.
-
Market Characteristic Risk: This strategy performs best in markets with clear trends but may frequently trigger false signals in sideways, choppy markets. Consider adding a market state filter to activate the strategy only in trending markets.
Strategy Optimization Directions
-
Add Market State Filtering: Implement automatic identification of market states (trending/ranging) and adjust strategy parameters or pause trading accordingly. This can be achieved through ADX indicators or volatility analysis, effectively reducing false signals in ranging markets.
-
Optimize Entry Timing: Consider looking for pullbacks as entry points after breakout confirmation, rather than entering directly at the breakout point. This can be judged using RSI indicators or Bollinger Band positions, improving the cost-effectiveness of entry prices.
-
Dynamic Position Sizing: Dynamically adjust position size based on market volatility and historical win rates, increasing positions when high-confidence signals appear and decreasing otherwise. This can improve capital utilization efficiency and risk-adjusted returns.
-
Adaptive Parameter System: Develop an adaptive parameter adjustment mechanism that allows the strategy to automatically adjust breakout length, ATR multiplier, and trailing stop distance based on market conditions. This can be implemented through dynamic parameter adjustments based on volatility over the past N days.
-
Add Trading Session Filters: Analyze strategy performance during different trading sessions, avoiding inefficient or high-risk periods, such as important data release times or periods of insufficient liquidity. This can be implemented through time filters, improving the overall stability of the strategy.
Conclusion
The Multi-Timeframe Trend-Filtered Momentum Breakout Trading Strategy is a well-structured quantitative trading system that improves trade signal quality through multi-timeframe analysis and achieves the trading goal of "preserving capital while maximizing profits" through intelligent position management. This strategy is particularly suitable for market environments with obvious trend characteristics and can effectively capture medium and short-term price movements.
By implementing the suggested optimization directions, especially market state filtering and dynamic parameter adjustment, the strategy can further enhance its adaptability and stability across different market environments. Before live implementation, it is recommended to conduct thorough historical backtesting and simulated trading, and make targeted adjustments based on the specific characteristics of the trading instrument.
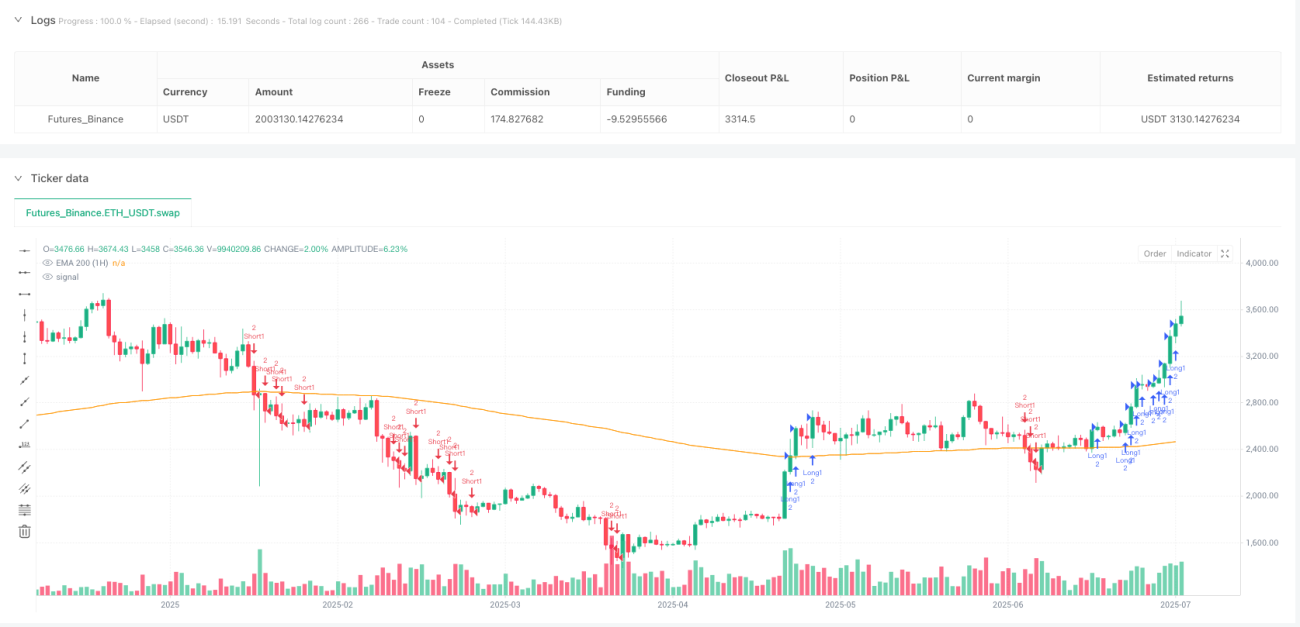
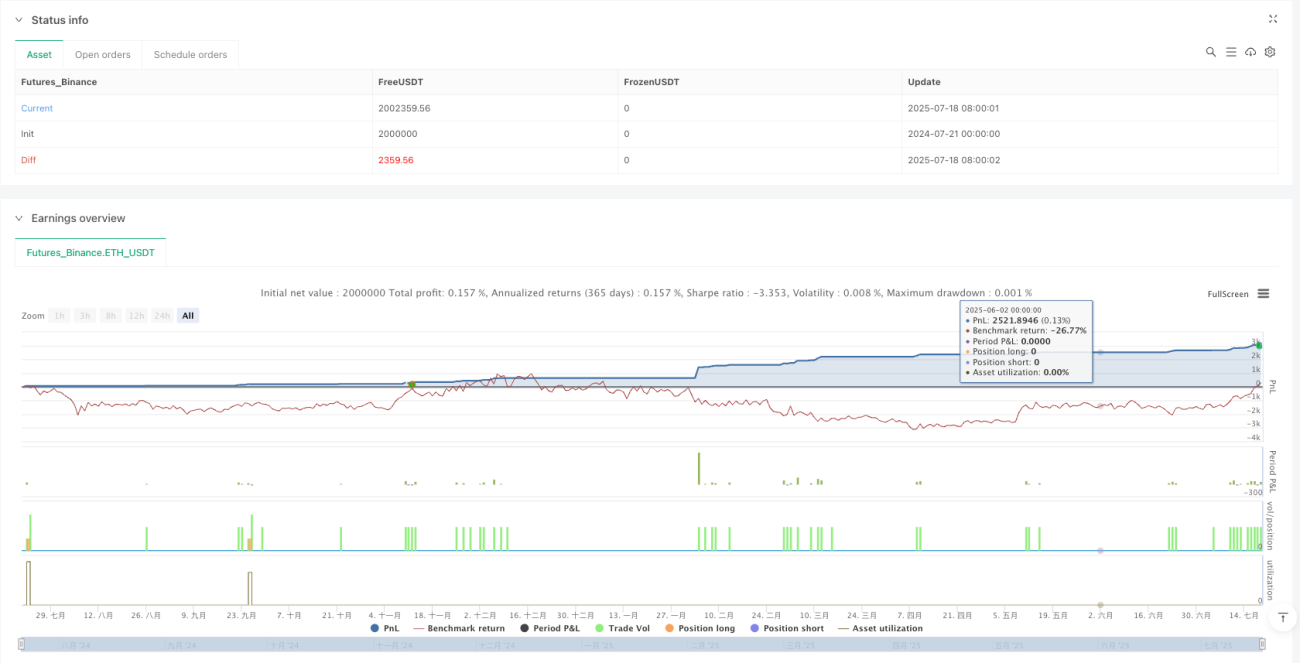
/*backtest
start: 2024-07-21 00:00:00
end: 2025-07-19 08:00:00
period: 1d
basePeriod: 1d
exchanges: [{"eid":"Futures_Binance","currency":"ETH_USDT","balance":2000000}]
*/

// MNQ 3m Momentum Breakout Strategy with HTF Trend Filter
//@version=5
strategy("MNQ 3m Momentum Breakout", overlay=true, default_qty_type=strategy.percent_of_equity, default_qty_value=100)
- 1