
Overview
The quantitative strategy "Multi-Indicator Fusion POMDP-Inspired Trading System" is a trading method based on technical analysis and Partially Observable Markov Decision Processes (POMDP). This strategy cleverly combines Stochastic RSI, Money Flow Index (MFI), Bollinger Bands, and Moving Average Convergence Divergence (MACD) to generate buy and sell signals. The core concept of the strategy is to construct a POMDP-like decision framework through multi-dimensional market state observations to address the uncertainty and partial observability of financial markets. This strategy is particularly suitable for trading scenarios with moderate price expectations, implementing a risk-controlled trading system through clearly defined entry and exit rules.
Strategy Principles
The core principle of this strategy is based on the concept of Partially Observable Markov Decision Processes (POMDP), viewing the market as a system with partially visible states. The market state is observed through the following key technical indicators:
-
Bollinger Bands: Using a 20-period simple moving average as the middle band, with a standard deviation multiplier of 2.0 to form the upper and lower bands, used to identify price volatility ranges.
-
Stochastic RSI: Combining the advantages of RSI and stochastic indicators, with a 14-period length and 3-period smoothing parameter, used to identify overbought and oversold conditions. A K value below 30 is considered oversold, while above 70 is considered overbought.
-
Money Flow Index (MFI): Calculated over a 14-period timeframe, measuring money flow through the product of typical price (TP) and volume. An MFI below 40 is considered an oversold signal, while above 60 is an overbought signal.
-
MACD Indicator: Using 12/26/9 parameter settings, the relationship between the MACD line and signal line is used to confirm trend direction.
The decision rules of the strategy are as follows:
- Long Condition (Call Debit Spread): When the K value is below 30 (oversold) or MFI is below 40 (oversold), and simultaneously the MACD line is above the signal line, a long signal is triggered.
- Short Condition (Put Debit Spread): When the K value is above 70 (overbought) or MFI is above 60 (overbought), and simultaneously the MACD line is below the signal line, a short signal is triggered.
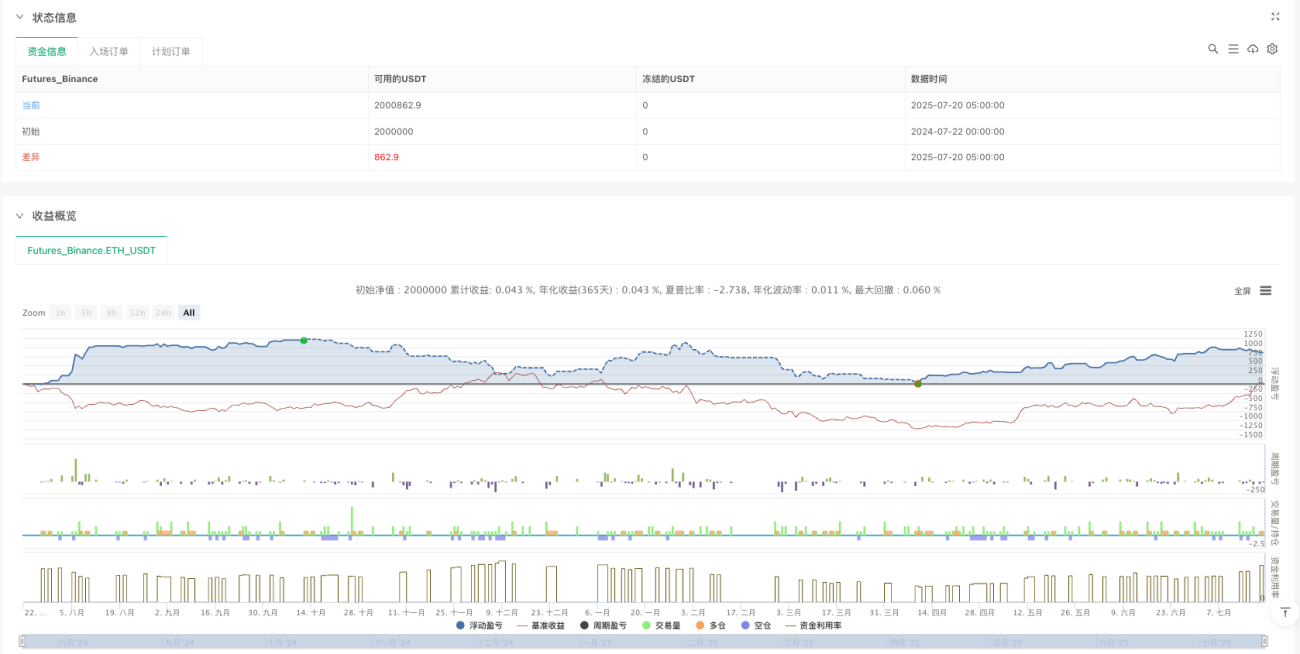
The strategy also implements a time-based automatic exit mechanism, setting positions to automatically close after 5 periods, effectively controlling position time risk.
Strategy Advantages
-
Multi-dimensional Signal Confirmation: By combining multiple technical indicators (Stochastic RSI, MFI, MACD), the strategy can observe market conditions from different angles, reducing the risk of misleading signals that might come from a single indicator.
-
Adaptability of the POMDP Framework: The introduction of POMDP concepts enables the strategy to make relatively optimized decisions under conditions of uncertainty and partial observability, better aligning with actual market environments.
-
Clear Risk Control: Through a fixed exit period (5 periods), the strategy implements time-dimension risk control, avoiding the expansion of losses from long-term adverse trends.
-
Complementary Technical Indicators: Stochastic RSI primarily reflects price momentum, MFI combines price and volume information, MACD captures trend changes, and Bollinger Bands define volatility ranges. These indicators complement each other, improving signal reliability.
-
Robust Code Implementation: The strategy uses math.sum instead of ta.sum when calculating MFI, correcting potential calculation errors and enhancing strategy stability.
-
Automated Execution Capability: Implementation in TradingView's Pine Script allows the strategy to automatically generate and execute trading signals, reducing human intervention and emotional influence.
Strategy Risks
-
Limitations of Overbought/Oversold Thresholds: The strategy uses fixed overbought/oversold thresholds (Stochastic RSI 30/70 and MFI 40/60). These fixed thresholds may not always be optimal across different market environments and different products, potentially leading to decreased signal quality.
-
Double-edged Sword of Time Exit Mechanism: The fixed 5-period exit mechanism, while controlling risk, may also prematurely exit favorable trends, limiting potential returns.
-
Multi-indicator Redundancy Risk: While multiple indicators provide multi-dimensional confirmation, there may be some correlation and redundancy between indicators, potentially leading to signal bias reinforcement under certain market conditions.
-
Insufficient Adaptability in Trending Markets: This strategy is primarily based on overbought/oversold and reversal signals, which may generate too many false signals in strong trending markets, leading to frequent trading and unnecessary costs.
-
Parameter Optimization Dependency: The strategy's effectiveness largely depends on the parameter settings of various indicators. Different market conditions may require different parameter combinations, increasing the complexity of strategy maintenance and adjustment.
-
Lack of Volatility Adaptation Mechanism: The strategy does not have an adaptive mechanism for market volatility changes, potentially generating more false signals in high-volatility environments.
Strategy Optimization Directions
-
Dynamic Parameter Adjustment Mechanism: Introduce parameter self-adaptation mechanisms based on market states, such as adjusting the Bollinger Bands standard deviation multiplier based on volatility, or adjusting overbought/oversold thresholds based on market trend strength, improving the strategy's adaptability across different market environments.
-
Improved Stop-Loss Mechanism: In addition to the time-dimension exit mechanism, add price-based stop-loss and take-profit mechanisms, such as setting ATR-based stop-loss points, enhancing comprehensive risk management.
-
Market Environment Filter: Add a market environment recognition module, such as trend strength indicators or volatility indicators, to reduce or pause trading in market environments unsuitable for the strategy, avoiding excessive trading under unfavorable conditions.
-
Signal Quality Scoring System: Develop a signal quality scoring mechanism to score signals based on factors such as the consistency of multiple indicators, market environment, and historical signal success rates, executing only high-quality signals to improve strategy effectiveness.
-
Machine Learning Enhancement: Combine the POMDP framework with machine learning methods to train and optimize decision strategies through historical data, enabling the system to learn from past trades and improve.
-
Capital Management Strategy Optimization: Introduce dynamic position management mechanisms to adjust trading size based on signal strength, market state, and account risk, implementing more scientific capital management.
Summary
The "Multi-Indicator Fusion POMDP-Inspired Trading System" is a quantitative trading strategy that combines multiple technical indicators with a POMDP decision framework. Through the synergy of Stochastic RSI, MFI, MACD, and Bollinger Bands, this strategy addresses the issue of partial market observability to a certain extent, providing multi-dimensional signal confirmation for trading decisions.
The main advantages of the strategy lie in its multi-angle market observation capability and clear risk control mechanisms, while also facing challenges such as parameter optimization dependency and insufficient adaptability in certain market environments. By introducing dynamic parameter adjustments, improving stop-loss mechanisms, adding market environment filters, and other optimization directions, this strategy has the potential to further enhance its robustness and adaptability.
Overall, this is a well-designed, logically clear quantitative trading system, particularly suitable for traders who have a certain predictive ability for markets but wish to control risk. Through continuous optimization and adaptation to different market environments, this strategy can become an effective tool in a trader's toolkit.
- 1