ADX and Supertrend Persistent Entry Strategy

Overview
The ADX and Supertrend Persistent Entry Trading Strategy is a quantitative trading method that combines directional indicators with trend confirmation tools. This strategy integrates the Average Directional Index (ADX), Directional Movement Index (DMI), and Supertrend indicator, supplemented by volume-weighted Order Block analysis to build a comprehensive trading system. The strategy particularly emphasizes a persistent condition verification mechanism, triggering trading signals only after multiple technical conditions are met, which effectively improves trading quality and reduces the occurrence of false signals.
Strategy Principles
The core logic of this strategy is based on the following key components:
-
ADX and DMI Indicator Analysis: The system uses the ADX indicator to measure market trend strength and determines trend direction by comparing +DI and -DI values. When the ADX value is above a set threshold (default 25), it indicates a strong market trend; +DI greater than -DI suggests a bullish trend, while the opposite indicates a bearish trend.
-
Supertrend Trend Confirmation: The Supertrend indicator serves as a secondary trend confirmation tool, supporting buying when it shows a bullish signal (trend == -1) and selling when it shows a bearish signal (trend == 1). Changes in Supertrend are also used as exit signal triggers.
-
Volume-Weighted Order Blocks: The strategy introduces a dynamic support and resistance zone identification mechanism based on volume. When volume exceeds a specific multiple of the average level (default 2x) and price reaches local highs or lows, the system marks these areas as potential order blocks and maintains their validity for a set period (default 15 periods).
-
Persistent Condition Verification: The most unique part of the strategy is its persistent condition verification mechanism. The system tracks various trading conditions through four boolean flags: trend condition, ADX condition, DMI condition, and zone condition. Trading signals are triggered only when all conditions are met. This mechanism ensures that trading occurs in optimal market environments.
Buy conditions:
- ADX above threshold (default 25)
- +DI greater than -DI
- Supertrend in bullish state
- Price not within volume resistance zone
Sell conditions:
- ADX above threshold (default 25)
- -DI greater than +DI
- Supertrend in bearish state
- Price not within volume support zone
Exit logic: When the Supertrend indicator changes trend direction, the strategy closes the current position.
Strategy Advantages
-
Multiple Confirmation Mechanism: By integrating multiple technical indicators, the strategy greatly reduces false signals and improves trading accuracy. The combination of ADX and Supertrend, in particular, ensures both trend strength and provides clear directional guidance.
-
Persistent Condition Verification: The strategy's persistent verification mechanism allows the system to act only when all conditions mature, rather than triggering trades based on single signals. This design greatly enhances the strategy's robustness and reduces unnecessary trades under unfavorable market conditions.
-
Dynamic Support and Resistance Identification: Volume-based order block analysis provides the strategy with dynamic support and resistance references, making trading decisions more aligned with market microstructure and avoiding counter-trend trading at key price zones.
-
Clear Exit Mechanism: The strategy uses Supertrend reversals as exit signals, providing objective and timely stop-loss and take-profit methods, effectively managing the risk of each trade.
-
High Adaptability: Through multiple adjustable parameters, the strategy can adapt to different market environments and trading instruments, enhancing its practicality and flexibility.
Strategy Risks
-
Parameter Sensitivity: The strategy's effectiveness largely depends on parameter settings. The choice of ADX length, Supertrend multiplier, and ATR period significantly impacts strategy performance. Inappropriate parameter settings may lead to overtrading or missing important opportunities. The solution is to optimize parameters through historical backtesting and prepare different parameter combinations for different market environments.
-
Trend Reversal Risk: Despite using multiple confirmation mechanisms, the strategy may still face lag risk during strong market reversals or high volatility environments. The solution is to consider introducing volatility filters or dynamically adjusting ADX thresholds to adapt to different market volatility states.
-
Volume Anomaly Risk: The strategy is relatively dependent on volume analysis and may produce incorrect order block identification in cases of abnormal volume (such as sudden non-regular large volume). The solution is to add volume smoothing processing or introduce additional anomaly detection mechanisms.
-
Over-Optimization Risk: Because the strategy contains multiple adjustable parameters, it can easily lead to over-optimization, making the strategy perform well on historical data but poorly in actual trading. The solution is to use forward testing and out-of-sample testing to ensure the strategy's robustness.
-
Liquidity Risk: In low-liquidity markets, large transactions may lead to slippage or order execution delays, affecting strategy effectiveness. The solution is to add additional liquidity filtering conditions in low-liquidity environments or adjust position size.
Strategy Optimization Directions
-
Dynamic Parameter Adjustment: The strategy can be further optimized to automatically adjust ADX thresholds and Supertrend parameters based on market volatility. For example, ADX thresholds can be increased during high volatility periods to reduce false breakout signals, and thresholds can be lowered during low volatility periods to increase sensitivity. This adaptive mechanism allows the strategy to better adapt to different market phases.
-
Time Filter Integration: Introducing time filters can avoid trading during market opening, closing, or periods of poor liquidity. This optimization is particularly suitable for intraday trading strategies and can significantly reduce unnecessary trades caused by market noise.
-
Multi-Timeframe Analysis: By integrating trend information from higher timeframes, the strategy can ensure that trading direction remains consistent with the larger trend. For example, executing trades only when daily and hourly trend directions align can improve win rates and reduce counter-trend trading risk.
-
Risk Management Enhancement: The current strategy's exit mechanism is relatively simple and can be enhanced by adding trailing stops, profit-to-loss ratio filtering, or volatility-based stop-loss calculations. These improvements can better protect profits and control risk for each trade.
-
Market State Classification: Introducing a market state classification mechanism enables the strategy to identify different market environments such as consolidation periods, trend periods, and high volatility periods, and adjust trading logic accordingly. This optimization can avoid trading under market conditions unsuitable for the strategy, further enhancing the strategy's robustness.
Summary
The ADX and Supertrend Persistent Entry Trading Strategy builds a comprehensive and robust trading system by integrating multiple technical indicators and a unique persistent condition verification mechanism. The strategy particularly emphasizes trading under ideal market conditions, avoiding many common false signal traps. Through the combined use of ADX, DMI, and Supertrend, the strategy can effectively identify strong trend environments and determine the correct trading direction; while volume-weighted order block analysis provides additional microstructure support, helping to avoid counter-trend trading at key support and resistance areas.
Despite its many advantages, users should still be aware of potential issues such as parameter sensitivity, trend reversal risk, and over-optimization. The strategy still has significant room for optimization through the introduction of dynamic parameter adjustment, multi-timeframe analysis, and enhanced risk management mechanisms. Ultimately, this approach, combining technical indicators and market microstructure analysis, represents a balanced and comprehensive quantitative trading approach suitable for investors seeking high-quality trading signals rather than high-frequency trading.
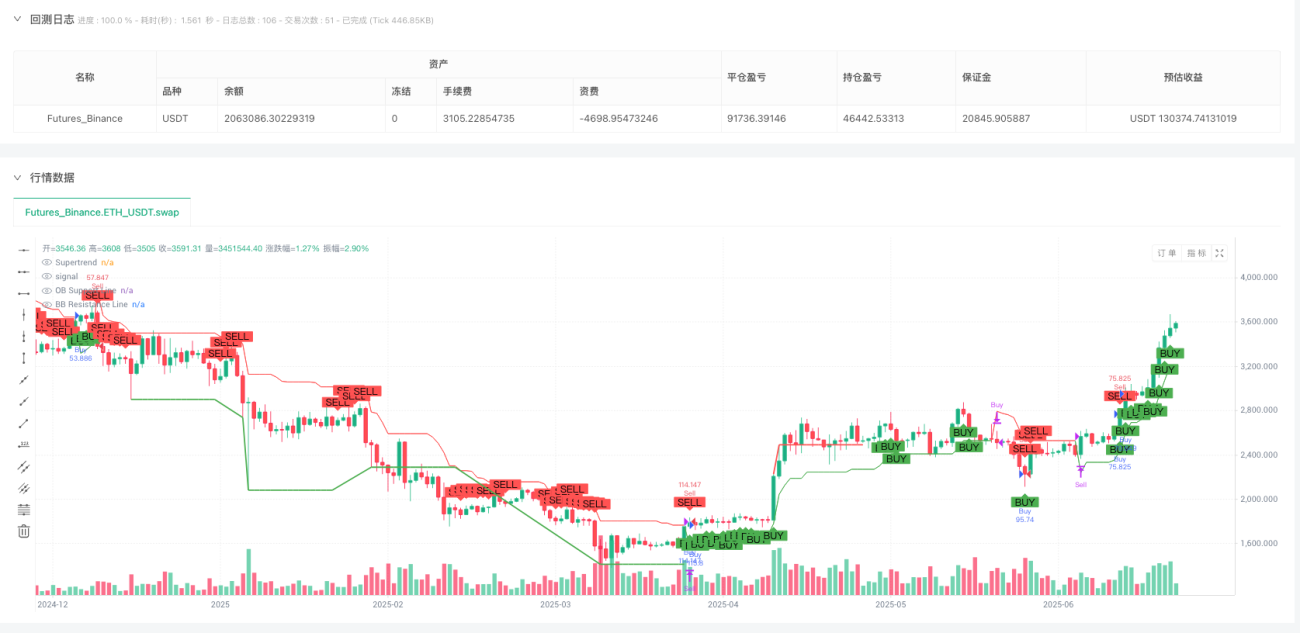
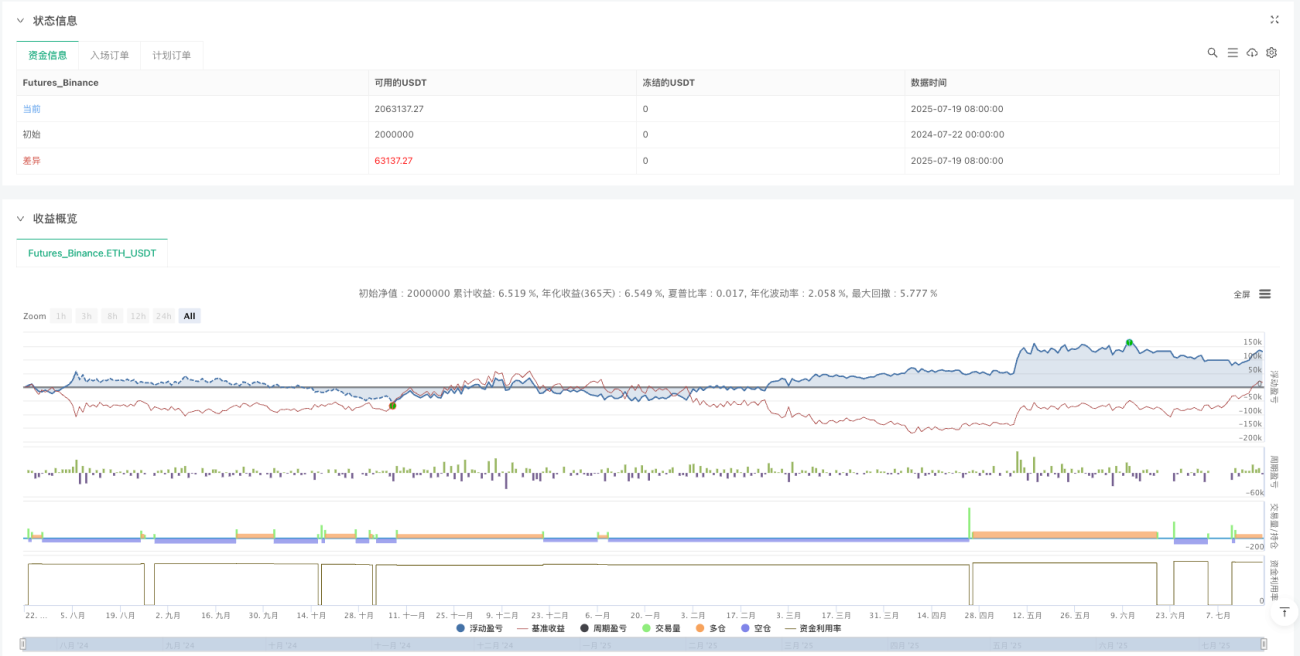
/*backtest
start: 2024-07-22 00:00:00
end: 2025-07-20 08:00:00
period: 1d
basePeriod: 1d
exchanges: [{"eid":"Futures_Binance","currency":"ETH_USDT","balance":2000000}]
*/

// This Pine Script™ code is subject to the terms of the Mozilla Public License 2.0 at https://mozilla.org/MPL/2.0/

// © algostudio
- 1