
Overview
The Trend-Following RSI with EMA Dual Confirmation Trading Strategy is a quantitative trading system that combines the Relative Strength Index (RSI) with Exponential Moving Averages (EMA). Unlike traditional RSI strategies, this approach incorporates a trend filtering mechanism that significantly enhances signal quality. The core concept involves requiring both RSI indication of overbought/oversold conditions and EMA confirmation of market direction, creating a dual confirmation mechanism. Additionally, the strategy features precise take-profit and stop-loss parameters, set by default at 1% for take-profit and 0.5% for stop-loss, establishing a 2:1 reward-to-risk ratio. This configuration is particularly suited for short-term traders and intraday momentum traders who prefer quick, consistent trades over long-term positions.
Strategy Principles
The trading logic of this strategy is based on two key components: RSI overbought/oversold signals and EMA trend confirmation.
-
Entry Signal Generation:
- Buy Condition: Triggered when RSI falls below 40 (oversold zone) and the fast EMA is above the slow EMA (uptrend)
- Sell Condition: Triggered when RSI rises above 60 (overbought zone) and the fast EMA is below the slow EMA (downtrend)
-
Trend Filtering Mechanism:
- The strategy uses two EMA lines with 9-period and 21-period for trend determination
- Trades are executed only when the RSI signal aligns with the EMA trend direction
- This mechanism effectively prevents counter-trend trading in strong trending markets
-
Risk Management:
- Each trade sets a 1% take-profit target
- Each trade implements a 0.5% stop-loss limit
- This creates a 2:1 reward-to-risk ratio, adhering to professional risk management principles
-
Capital Management:
- By default, each trade uses 10% of account equity (adjustable)
- Accounts for 0.04% trading commission (similar to Binance spot)
- Considers 2 price ticks of slippage
In the code implementation, the strategy first calculates the 14-period RSI value and the 9-period and 21-period EMA values. Based on these indicators, it defines bullish conditions (RSI<40 and fast EMA>slow EMA) and bearish conditions (RSI>60 and fast EMA<slow EMA). When these conditions are met, the strategy executes the corresponding long or short trades and sets appropriate take-profit and stop-loss levels.
Strategy Advantages
-
Dual Confirmation Mechanism: This strategy doesn't rely solely on RSI overbought/oversold signals but also requires EMA indicators to confirm the market trend direction. This dual confirmation mechanism significantly improves the reliability of trading signals and reduces the occurrence of false signals.
-
Trend Following: Through EMA trend filtering, the strategy ensures that the trading direction aligns with the current market trend. This avoids the risk of counter-trend trading in strong trends, adhering to the trading maxim "the trend is your friend."
-
Clear Risk Management: The strategy incorporates precise take-profit and stop-loss mechanisms, with a default 2:1 reward-to-risk ratio that complies with professional trading standards. This setup not only protects capital safety but also ensures the possibility of long-term profitability.
-
High Customizability: The strategy offers multiple adjustable parameters, including RSI length, RSI thresholds, EMA periods, and take-profit/stop-loss percentages. This allows traders to optimize according to different market environments and personal risk preferences.
-
Suitable for Short-term Trading: The design is particularly suitable for high-frequency short-term traders, capturing small fluctuations through quick market entries and exits rather than pursuing large movements. This characteristic is especially effective on the 15-minute timeframe.
-
Visual Support: The strategy provides rich visual elements, including RSI indicator lines, buy/sell threshold lines, and EMA trend lines, allowing traders to intuitively understand market conditions and signal trigger reasons.
-
Alert Functionality: Built-in buy/sell signal alerts enable traders to be promptly notified of trading opportunities without constant chart monitoring, improving trading efficiency.
Strategy Risks
-
Poor Performance in Ranging Markets: In markets without clear trends, RSI may frequently oscillate between overbought and oversold regions, and EMA lines may cross frequently, leading to excessive trading signals and potential consecutive losses.
Solution: Consider pausing trading in low volatility environments or adding a volatility filter (such as ATR) to avoid trading in ranging markets.
-
Limitations of Fixed Take-Profit/Stop-Loss: Using fixed percentage take-profit/stop-loss may not be suitable for all market conditions. In high-volatility markets, a 0.5% stop-loss might be too small, while in low-volatility markets, a 1% take-profit might be too large.
Solution: Consider implementing dynamic take-profit/stop-loss mechanisms, such as ATR-based stops or automatically adjusted take-profit/stop-loss ratios based on market volatility.
-
Capital Management Risk: Consistently using 10% of account funds may lead to rapid capital reduction during consecutive losses.
Solution: Implement more conservative capital management strategies or use position sizing methods based on the Kelly formula.
-
Parameter Sensitivity: Strategy performance is highly dependent on the selection of RSI and EMA parameters; inappropriate parameters may lead to poor strategy performance.
Solution: Conduct comprehensive parameter optimization and robustness testing to ensure the strategy maintains stable performance across different parameter settings.
-
Slippage and Execution Risk: In highly volatile markets, actual execution prices may differ significantly from signal trigger prices, affecting strategy performance.
Solution: Increase slippage tolerance or use limit orders instead of market orders in live trading.
Strategy Optimization Directions
-
Add Volatility Filter:
Introducing the ATR (Average True Range) indicator as a volatility filter can help avoid ineffective trades in low-volatility markets. When ATR falls below a specific threshold, one can choose not to execute trades or adjust the take-profit/stop-loss ratio. This is because low-volatility markets typically indicate a lack of clear direction, and trading results may be poor. -
Dynamic Take-Profit/Stop-Loss Mechanism:
Changing fixed percentage take-profit/stop-loss to a dynamic mechanism based on market volatility, such as using multiples of ATR to set stop-losses. This better adapts to different market environments, providing more flexible stop-loss space in high-volatility markets and avoiding premature stopping out due to short-term fluctuations. -
Add Time Filter:
Certain market periods have better volatility and liquidity, yielding better trading results. By adding a time filter to trade only during specific periods (such as main trading sessions), overall strategy performance can be improved. -
Incorporate Volume Confirmation:
Price movements should be accompanied by corresponding volume changes to be more credible. By adding volume confirmation mechanisms, suspicious signals in low-volume environments can be filtered out, improving trading quality. -
Optimize Parameter Adaptation Mechanism:
Market conditions constantly change, and fixed parameters may not always be optimal. Implementing parameter adaptation mechanisms, such as automatically adjusting RSI thresholds based on recent market volatility or adjusting EMA periods based on trend strength, can help the strategy better adapt to different market environments. -
Add Trend Strength Filter:
In addition to EMA crossovers, consider adding ADX (Average Directional Index) as a measure of trend strength. Executing trades only when ADX is above a specific threshold (indicating a strong trend) can improve signal quality. -
Multi-Timeframe Analysis:
Using the trend direction of higher timeframes as an additional filter condition ensures that the trading direction aligns with the larger trend. This follows the "top-down" analysis method and can significantly improve trading success rates.
Conclusion
The Trend-Following RSI with EMA Dual Confirmation Trading Strategy creates a balanced and efficient trading system by combining RSI overbought/oversold signals with EMA trend confirmation. This strategy reduces false signals through its dual confirmation mechanism, ensures trend-following through trend filtering, and safeguards risk management through precise take-profit/stop-loss settings. It is particularly suitable for high-frequency short-term trading on the 15-minute timeframe, providing a powerful tool for traders seeking quick, consistent trades.
While this strategy performs excellently in clearly trending markets, it may face challenges in ranging markets. By adding volatility filters, dynamic take-profit/stop-loss mechanisms, time filters, volume confirmation, and multi-timeframe analysis as optimization measures, the robustness and profitability of this strategy can be further enhanced. Overall, this is a well-designed, logically clear, and practically valuable quantitative trading strategy that provides traders with a reliable market participation framework.
As with any quantitative trading system, continuous monitoring, evaluation, and optimization remain crucial. Market conditions change constantly, and successful trading strategies need to adapt and evolve continuously. By deeply understanding the strategy principles and making necessary adjustments, traders can fully leverage the potential of this strategy to gain sustained trading advantages in complex and changing markets.
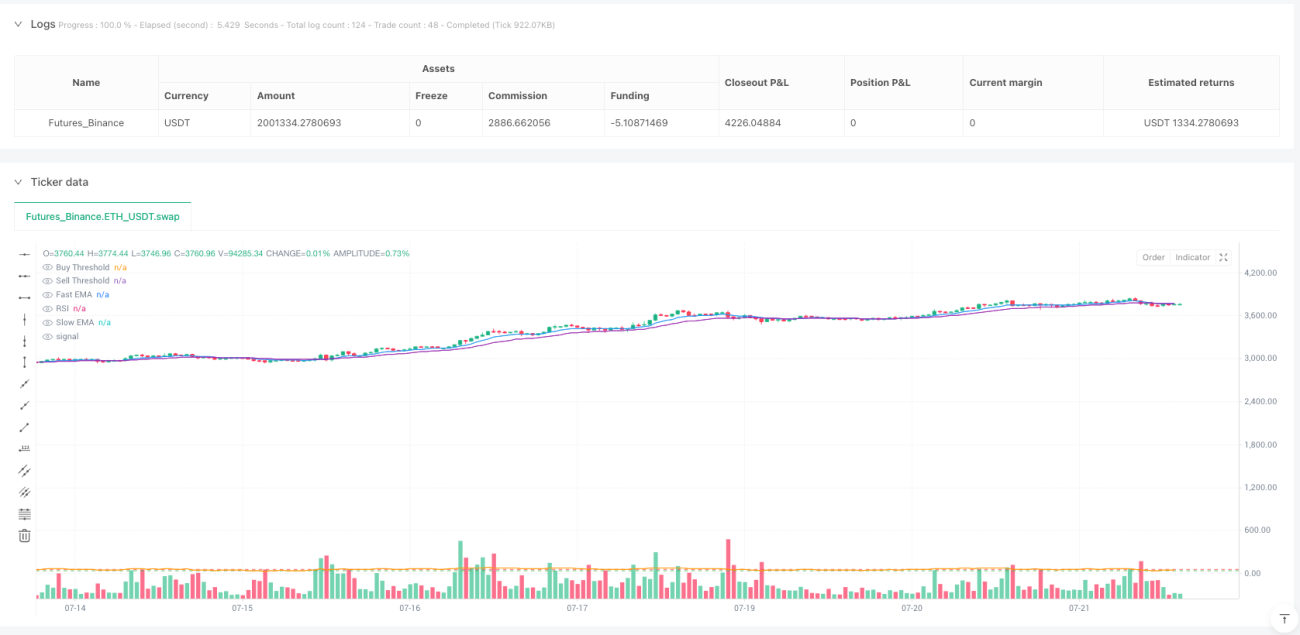
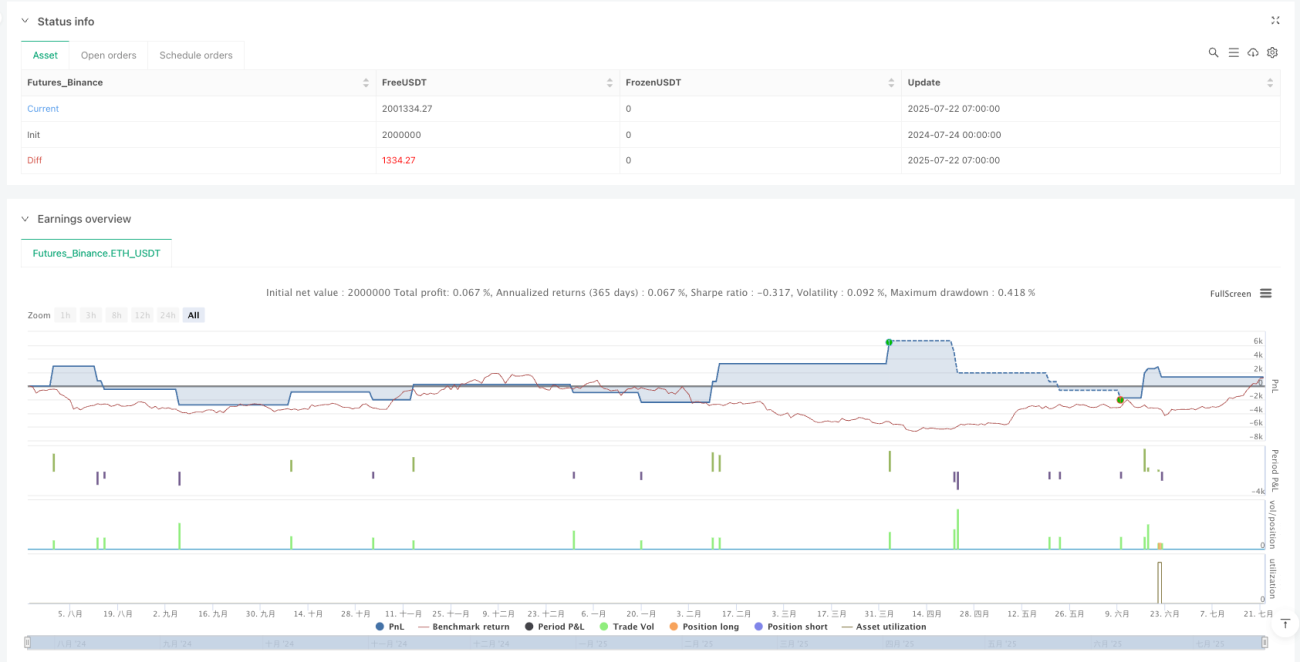
/*backtest
start: 2024-07-24 00:00:00
end: 2025-07-22 08:00:00
period: 1h
basePeriod: 1h
exchanges: [{"eid":"Futures_Binance","currency":"ETH_USDT","balance":2000000}]
*/

//@version=5
strategy("🧠 Aggressive RSI + EMA Strategy with TP/SL", overlay=true, default_qty_type=strategy.percent_of_equity, default_qty_value=10, commission_type=strategy.commission.percent, commission_value=0.04, slippage=2)

// === INPUTS ===- 1