
Overview
The Adaptive Multi-State Moving Average Crossover Strategy is a technical analysis trading system that intelligently adapts to market conditions. The core of this strategy lies in identifying four distinct market states and dynamically switching between optimal moving average types and parameters for each state. The system classifies market conditions by analyzing the slope of a benchmark moving average line and the price's relative position to this line, dividing the market into four states: bullish trend, pullback correction, rebound fluctuation, and bearish decline. For each market state, the strategy automatically selects the most suitable combination of short-term and long-term moving averages (choosing from SMA, EMA, RMA, and HMA) to capture golden cross and death cross signals for precise entry and exit timing. This strategy has undergone rigorous random parameter search optimization and demonstrated exceptional profitability and robustness across multiple timeframes.
Strategy Principle
The core principle of this strategy is based on the combination of market state classification and dynamic parameter optimization. The specific implementation steps are as follows:
-
Market State Identification: The strategy uses EMA(20) as the benchmark line and classifies the market into four states by analyzing its slope (rising or falling) and the price's relative position (above or below the benchmark line):
- State "11": Bullish trend (positive slope, price above benchmark)
- State "10": Pullback correction (positive slope, price below benchmark)
- State "01": Rebound fluctuation (negative slope, price above benchmark)
- State "00": Bearish decline (negative slope, price below benchmark)
-
Parameter Optimization: For each market state, the strategy identifies the optimal moving average type and period through random search of 200 parameter combinations:
- State "00": Short-term EMA(15) and long-term HMA(24)
- State "01": Short-term SMA(19) and long-term RMA(45)
- State "10": Short-term RMA(16) and long-term HMA(59)
- State "11": Short-term RMA(12) and long-term RMA(36)
-
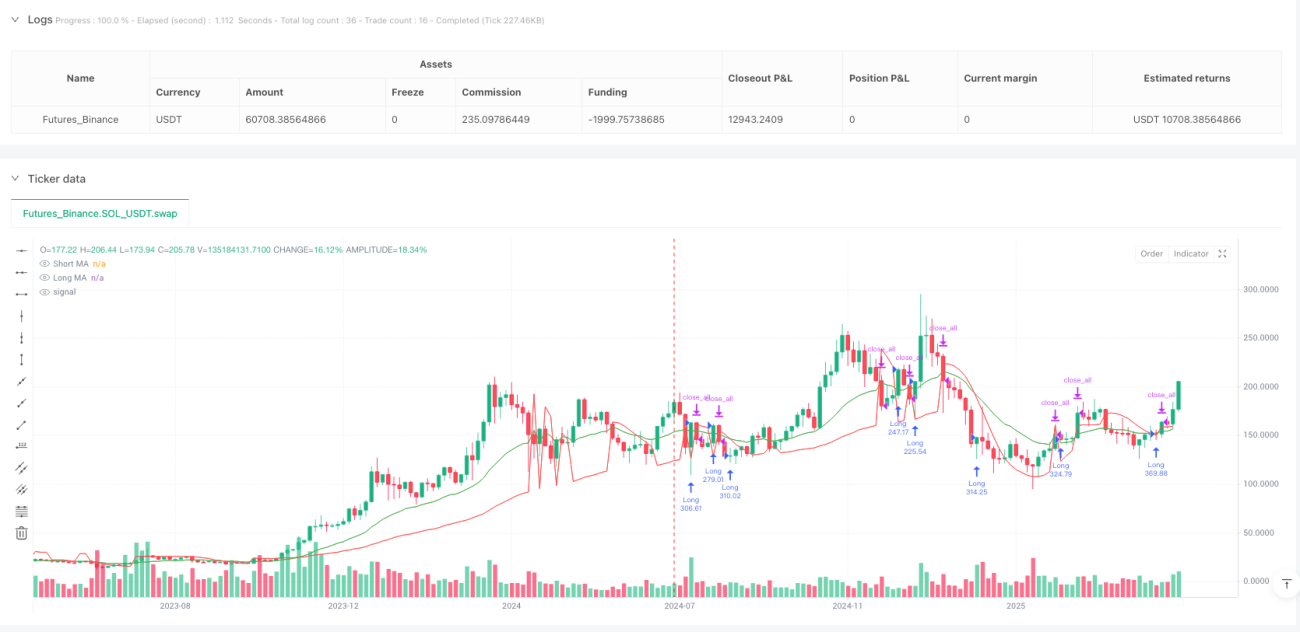
Signal Generation: The strategy generates trading signals by monitoring crossovers between short-term and long-term moving averages:
- Golden Cross (short-term line crosses above long-term line): Long entry signal
- Death Cross (short-term line crosses below long-term line): Position closing signal
-
Execution Logic: The strategy adopts a long-only approach, entering long positions at golden crosses and closing positions at death crosses, without implementing short trades.
The strategy was initially optimized using Python and then implemented in Pine Script v5 for backtesting and visualization on the TradingView platform.
Strategy Advantages
After in-depth code analysis, this adaptive multi-state moving average crossover strategy demonstrates several significant advantages:
-
Strong Market Adaptability: The strategy intelligently identifies four different market states and dynamically switches to optimal parameter combinations, effectively avoiding the lag and maladaptation of traditional fixed-parameter moving average strategies in changing markets.
-
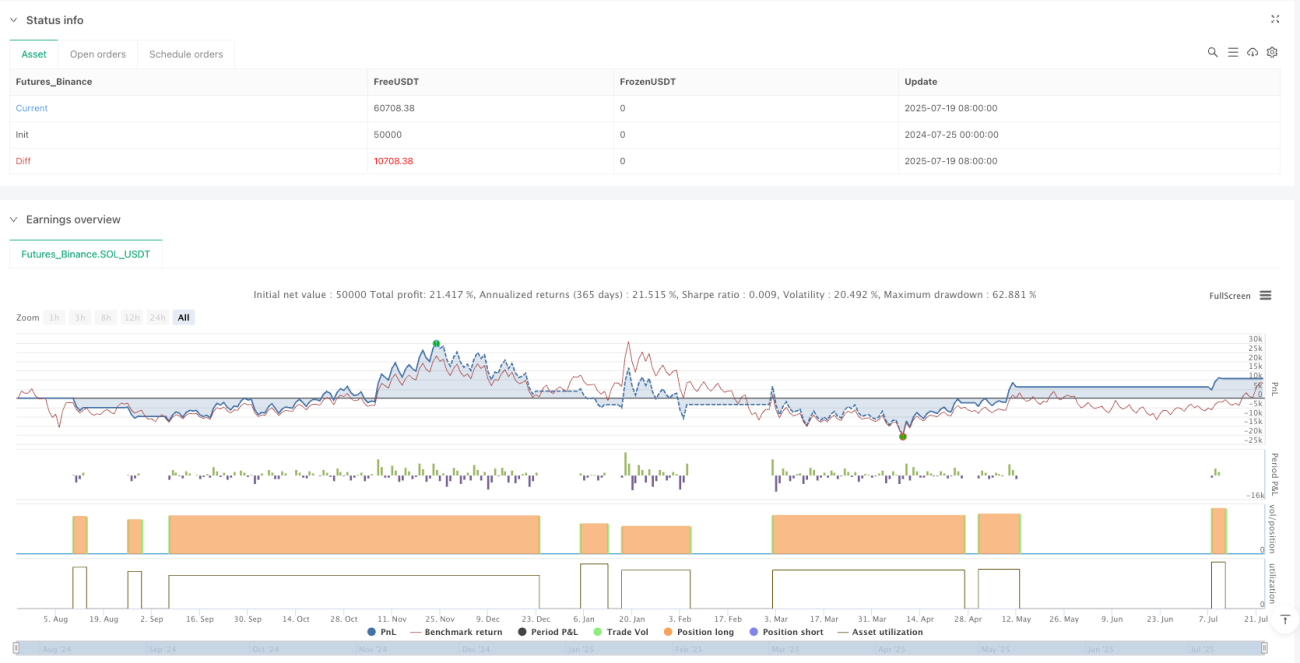
Multi-Timeframe Robustness: The strategy performs excellently across multiple timeframes, maintaining profitability from daily charts (+1691%) to hourly charts (+1731%) to minute charts (+9.34%), demonstrating robustness and noise resistance.
-
Scientific Parameter Optimization: The random search method evaluates 200 parameter combinations, considering cumulative returns, Sharpe ratio, maximum drawdown, and R² value of the linear regression on the return curve, ensuring that selected parameters offer both good performance and avoid overfitting.
-
Concise and Efficient Implementation: The code structure is clear, the logic is concise, and the execution is efficient, making it easy to understand and maintain. The modular design allows for easy extension and customization.
-
Reasonable Risk Management: Despite using 100% position size and 100x leverage in backtesting, the strategy did not trigger any margin calls during the testing period, indicating inherent risk control capability.
-
Diversified Technical Indicators: The strategy flexibly utilizes different types of moving averages (SMA, EMA, RMA, HMA), taking advantage of various indicators' strengths in different market states.
Strategy Risks
Despite its many advantages, the following potential risks should be addressed:
-
One-Sided Strategy Limitation: The strategy only supports long operations and does not execute short trades, potentially missing opportunities in continuously declining markets. This can be complemented by adding short logic or combining with other bear market strategies.
-
Parameter Sensitivity: Although parameters are optimized through random search, there may still be dependence on specific periods and datasets. Forward testing and parameter stability analysis are recommended before live trading.
-
Lack of Stop-Loss Mechanism: The code does not include explicit stop-loss strategies, which may lead to larger drawdowns in extreme market conditions. It is advisable to add appropriate stop-loss mechanisms based on personal risk tolerance.
-
Trading Cost Impact: The strategy backtesting sets trading fees at 0.055%, but actual environments may face higher trading costs or slippage, affecting real returns. Sensitivity testing under different trading cost assumptions is necessary.
-
Market Environment Change Risk: Strategy optimization is based on specific historical data (2024 Bitcoin contract data); parameters may need to be re-optimized when market structure changes significantly. Regular performance checks and timely parameter adjustments are recommended.
-
Frequent State Switching: In highly volatile markets, states may switch frequently, leading to overtrading. Consider adding signal filtering mechanisms or state confirmation conditions to reduce false signals.
Strategy Optimization Directions
Based on strategy characteristics and potential risks, the following optimization directions are recommended:
-
Bi-Directional Trading Mechanism: Extend the strategy to support short trading, designing corresponding short parameters for different market states to improve performance in bear markets.
-
Dynamic Position Management: Adjust position size dynamically based on market state, signal strength, or historical performance, increasing positions with high-confidence signals and reducing risk exposure in uncertain conditions.
-
Multi-Level Stop-Loss Mechanism: Introduce multi-tiered stop-loss strategies, including fixed stops, trailing stops, and time-based stops, to enhance strategy survival in extreme markets.
-
Signal Filtering Optimization: Add additional filtering conditions such as trend strength confirmation, volume verification, or other technical indicator confirmation to reduce false signals and overtrading in oscillating markets.
-
Adaptive Parameter Optimization: Design periodic automatic optimization mechanisms to adjust parameter combinations based on the latest market data, maintaining strategy adaptability to market changes.
-
Multi-Timeframe Coordination: Integrate signal generation logic from multiple timeframes, requiring consistency between short-term and long-term timeframe signals before executing trades to improve signal reliability.
-
Risk Parity Allocation: When applied to multi-asset trading, consider incorporating a risk parity model to allocate funds reasonably based on asset volatility, optimizing overall portfolio performance.
These optimization directions can not only improve the strategy's robustness and profitability but also help it better adapt to different market environments and trading requirements.
Summary
The Adaptive Multi-State Moving Average Crossover Strategy is an intelligent quantitative trading system that combines market state recognition with dynamic parameter optimization. By analyzing the slope of the benchmark moving average and price position, the strategy divides the market into four states and configures optimal moving average combinations for each state, effectively capturing golden cross and death cross signals.
The strategy has demonstrated impressive performance in backtests across multiple timeframes, particularly achieving a return of 1731% in the 6-hour timeframe. Its core advantages include strong market adaptability, scientific parameter optimization, concise and efficient implementation, and multi-timeframe robustness.
However, the strategy still has risk points such as one-sided trading limitations and lack of comprehensive stop-loss mechanisms. These can be addressed through introducing bi-directional trading mechanisms, dynamic position management, multi-level stop-loss strategies, and other optimization directions to further enhance its robustness and practicality.
Overall, this is a quantitative trading strategy based on solid technical analysis principles with intelligent adaptability, suitable as a core component of trend-following systems or in combination with other strategies to build more comprehensive trading systems. Through continuous optimization and market validation, this strategy has the potential to become a stable and reliable quantitative trading tool.
- 1