Temporal Performance Analysis SuperTrend Optimization Strategy

Overview
This strategy is a trading system based on the SuperTrend indicator, combined with a comprehensive daily performance analysis framework that tracks and analyzes strategy performance across different time periods. The strategy generates trading signals through ATR (Average True Range) and SuperTrend indicators while incorporating a powerful performance analysis tool that statistically analyzes trading results for different days of the week and different dates of the month. This provides traders with data-driven decision support, helping to identify optimal trading times and optimize trading strategies.
Strategy Principle
The core of this strategy consists of two parts: the trading signal generation mechanism and the performance analysis system.
-
Trading Signal Generation Mechanism:
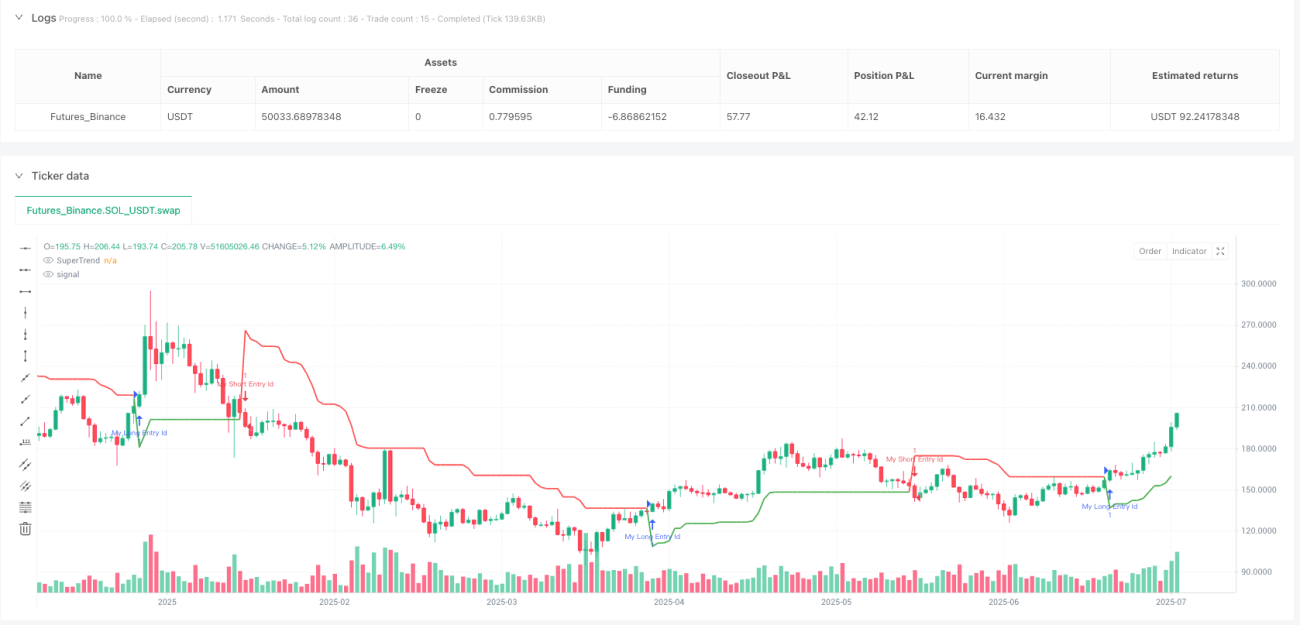
- Generates entry signals based on the SuperTrend indicator
- SuperTrend is a trend-following indicator that combines ATR with a custom factor
- Trading signals are triggered when the SuperTrend indicator direction changes
- When direction changes from negative to positive, a long position is executed
- When direction changes from positive to negative, a short position is executed
-
Performance Analysis System:
- Creates a specialized data structure (DayStats) to record statistics for each trading day
- Tracked metrics include: win/loss trade count, gross profit, gross loss
- Calculates derivative indicators: net profit, profit factor, win rate
- Separately tracks performance metrics for each day of the week (Monday through Sunday)
- Simultaneously monitors trading performance for each day of the month (1-31)
- Visualizes performance data through tables, including different colors to indicate profit/loss status
The strategy utilizes the object-oriented features of Pine Script, creating a DayStats class to store and update trading statistics, achieving efficient data management and calculation. Through the update_all_stats() function, relevant statistics are updated after each trade, ensuring that performance data reflects the latest trading results in real-time.
Strategy Advantages
-
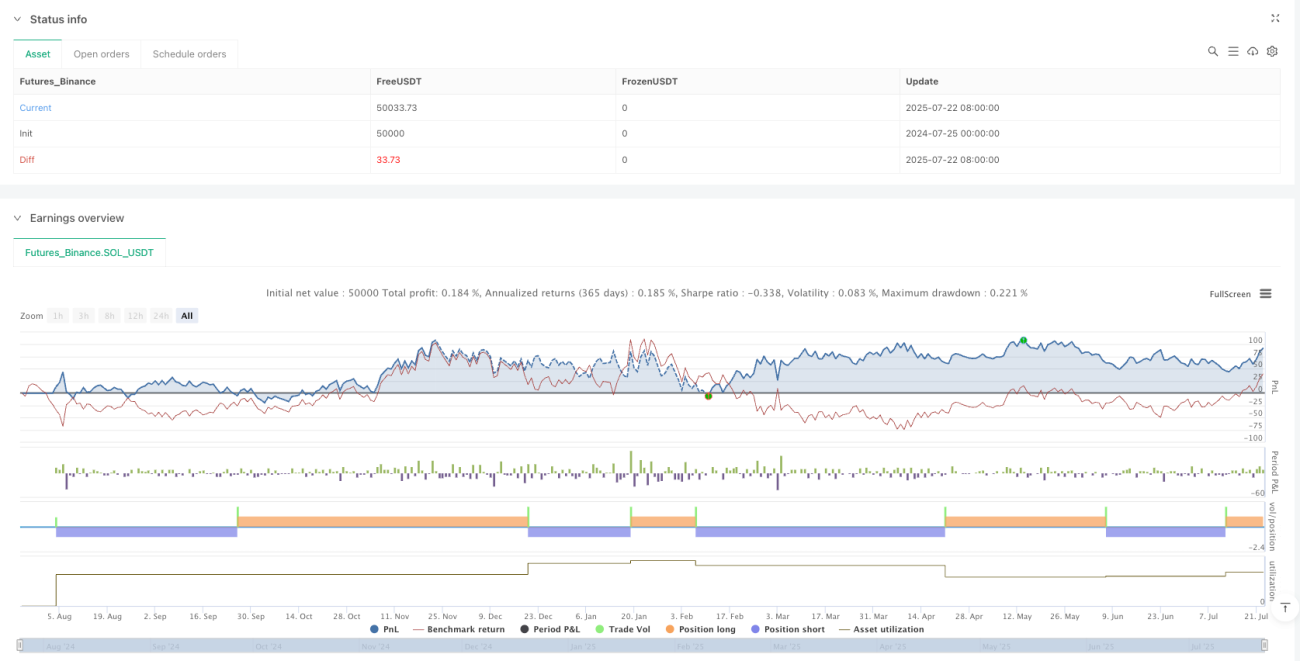
Comprehensive Temporal Dimension Analysis: The most significant advantage of this strategy is its ability to deeply analyze trading performance from a temporal dimension, helping traders identify which specific dates or days of the week yield the best trading results, providing a solid data foundation for time-filtering strategies.
-
Data-Driven Decision Support: By detailed statistical analysis of key indicators such as win rate, profit factor, and net profit for each trading day, traders can make trading decisions based on objective data rather than subjective feelings, reducing the interference of emotional factors.
-
Enhanced Risk Management: By identifying historically underperforming trading days, traders can choose to avoid trading on these days or adjust position sizes, effectively reducing systemic risk.
-
Visualized Performance Display: The built-in table display function intuitively presents trading performance across various time periods, using different colors to identify profit and loss status, allowing traders to grasp strategy performance at a glance.
-
High Customization: The strategy provides multiple input parameters, including ATR period, SuperTrend factor, table position, and color settings, allowing traders to adjust according to personal preferences and market characteristics.
-
Flexible Integration Capability: The performance analysis portion of the code is designed to be easily integrated into other trading strategies, enhancing the strategy's practicality and extensibility.
Strategy Risks
-
Insufficient Sample Data Risk: When trading samples are limited, statistical results for certain dates may not be statistically significant. Decisions based on this limited data may lead to incorrect optimization directions. The solution is to ensure a sufficiently long backtesting period to obtain more trading samples and improve statistical reliability.
-
Overfitting Risk: Excessive reliance on historical performance for specific dates may cause the strategy to overfit historical data and fail when future market environments change. Traders should use temporal analysis as a reference factor rather than the sole decision basis and regularly verify the stability of analysis results.
-
Signal Generation Mechanism Limitations: The SuperTrend indicator may produce frequent false signals in oscillating markets, leading to overtrading and unnecessary losses. It is recommended to use this in strong trend markets or combine with other confirmation indicators to filter out false signals.
-
Computational Resource Consumption: As the number of trades increases, the amount of data that needs to be stored and processed by the performance analysis system also increases, potentially affecting strategy operating efficiency. Attention should be paid to resource usage in long-term backtesting or live trading.
-
Seasonal Factor Influence: Some markets have seasonal patterns, and analyzing solely by day of week or month may ignore the influence of longer-cycle seasonality. Consider adding quarterly or annual level analysis to capture longer-cycle patterns.
Strategy Optimization Directions
-
Multiple Timeframe Analysis: The current strategy only analyzes performance within a single timeframe. It can be extended to simultaneously analyze trading performance across multiple timeframes, such as examining performance differences between daily, 4-hour, and 1-hour charts, to gain more comprehensive temporal dimension insights.
-
Add Market Condition Classification: Incorporate market condition classification into performance analysis, such as distinguishing performance in trending versus oscillating markets, or differences between high and low volatility environments, to help discover the strategy's advantages and disadvantages in specific market environments.
-
Signal Quality Scoring System: Introduce a signal quality scoring mechanism based on factors such as technical indicator consistency, price structure, volume confirmation, etc., to score each trading signal and incorporate signal quality dimension into performance analysis, helping to identify characteristics of high-quality signals.
-
Adaptive Parameter Optimization: Automatically adjust SuperTrend's ATR period and factor parameters based on historical performance data, enabling the strategy to adapt to changes in different market conditions, improving strategy adaptability and robustness.
-
Integrate Economic Calendar Data: Integrate information about important economic data releases, central bank decisions, and other events into performance analysis, studying patterns in trading performance before and after specific economic events, providing event-driven decision support for traders.
-
Expand Statistical Indicators: Add more statistical indicators, such as maximum consecutive profitable/losing trades, average profit/loss ratio, Sharpe ratio, etc., to provide deeper performance evaluation and help traders more comprehensively understand strategy characteristics.
-
Machine Learning Pattern Recognition: Introduce simple machine learning algorithms to automatically identify potential temporal patterns and regularities from historical performance data, predict possible performance for future trading days, and provide forward-looking guidance for trading decisions.
Summary
The Temporal Performance Analysis SuperTrend Optimization Strategy is an innovative solution that combines a trend-following trading system with comprehensive temporal dimension performance analysis. This strategy not only provides trading signals based on the SuperTrend indicator but, more importantly, builds a powerful analytical framework capable of systematically evaluating strategy performance differences across various time periods.
By detailed tracking of trading results across different days of the week and month, traders can identify time patterns with statistical advantages and specifically optimize trading strategies. The value of this analytical framework is not limited to the current SuperTrend strategy but can be easily integrated into other trading systems, providing temporal dimension optimization ideas for various strategies.
This data-driven approach elevates intuitive trading to the level of quantitative analysis, allowing traders to make more rational decisions based on objective statistical data. As trading samples accumulate and analytical dimensions expand, the value of this strategy will further increase, providing traders with increasingly precise temporal optimization guidance.
- 1