Dynamic Dual-Moving Average Crossover Strategy with Typical Price Anchored VWAP and ATR-Based Risk Management

Overview
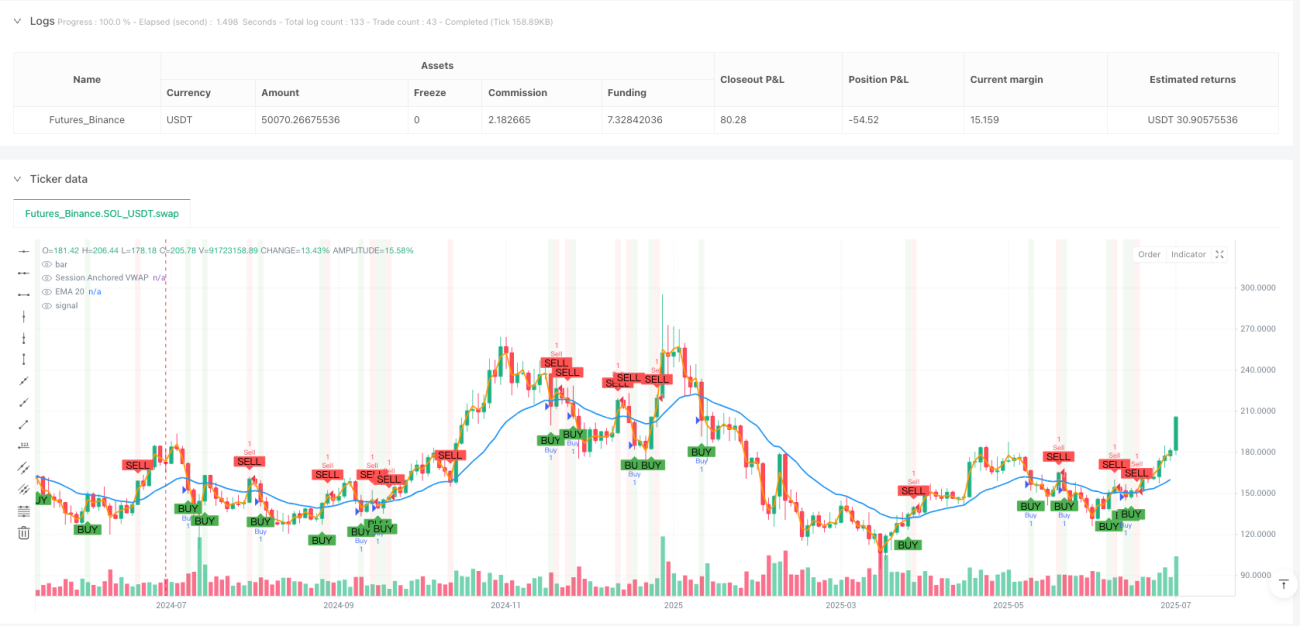
This strategy is a technical indicator-based intraday scalping system that primarily utilizes the relationship between the 20-period Exponential Moving Average (EMA 20) and the Volume Weighted Average Price (VWAP) calculated using typical price to determine trading signals. The strategy employs dynamic stop-loss and profit target settings, precisely calculating risk-reward ratios through ATR (Average True Range) and the size of the weapon candle (signal candle), thereby achieving a balance between risk control and profit maximization. This strategy is particularly suitable for volatile market environments, capturing profits by identifying turning points in short-term price trends.
Strategy Principles
The core principle of this strategy is based on the crossover relationship between two moving averages (EMA 20 and anchored VWAP) and the interaction of price with these averages. Specifically:
-
Entry Signal Generation Mechanism:
- Buy Condition: Triggered when EMA 20 is above VWAP and the closing price crosses above EMA 20 from below, or when EMA 20 crosses above VWAP.
- Sell Condition: Triggered when EMA 20 is below VWAP and the closing price crosses below EMA 20 from above, or when EMA 20 crosses below VWAP.
-
Application of Typical Price: The strategy uses typical price (high + low + close)/3 to calculate VWAP, providing more comprehensive price information than using closing price alone.
-
Intraday Anchored VWAP: VWAP resets at the beginning of each trading day, ensuring the indicator reflects the price-volume relationship of the current day, suitable for intraday traders.
-
Dynamic Risk Management:
- Stop Loss Setting: Based on ATR multiplied by a user-defined multiplier (default 2.0), providing a dynamic stop loss point based on market volatility.
- Profit Target: Based on the size of the signal candle, buy target is set at the signal candle's high plus twice the candle size, sell target is set at the signal candle's low minus twice the candle size.
-
Risk-Reward Ratio: The strategy defaults to a 1:3 risk-reward ratio, meaning the potential reward is three times the potential risk, aligning with professional traders' risk management standards.
Strategy Advantages
-
Integration of Technical Indicators: Combines the trend-following capability of EMA with the volume-weighted advantage of VWAP, making signals more reliable.
-
Volatility-Adaptive Dynamic Stop Loss: Calculates stop loss positions through ATR, allowing stop loss points to automatically adjust according to actual market volatility, avoiding the inflexibility of fixed stop loss points in different volatile environments.
-
Candle Size-Based Target Setting: Uses the actual size of the signal candle to determine target prices, a method that better adapts to the current market's volatility characteristics, setting farther targets in high volatility and closer targets in low volatility.
-
Daily Reset VWAP Calculation: Recalculates VWAP every trading day, avoiding interference from historical data on the current trading day, providing a clearer intraday price reference.
-
Multiple Confirmation Mechanism: Requires combined conditions of moving average crossovers and price crossovers, reducing the possibility of false signals and improving trading accuracy.
-
Intuitive Visualization: The strategy provides clear graphic markers, including buy/sell signals, stop loss, and target price lines, allowing traders to intuitively understand and execute trading decisions.
Strategy Risks
-
Moving Average Lag Risk: Although EMA responds faster than simple moving averages, it still has a certain lag, potentially causing missed optimal entry points or delayed signals in rapidly changing markets.
-
VWAP Calculation Dependency on Volume: In cases of abnormal volume, such as large single trades by institutional investors, VWAP may deviate, affecting signal accuracy.
-
Trading Frequency Risk: In oscillating markets, moving averages may cross frequently, leading to overtrading and increased transaction costs.
-
Stop Loss Trigger Risk: The market may experience short-term price spikes, triggering stop losses before returning to the original trend direction, causing unnecessary losses.
-
Limitations of Target Price Setting: Target setting based on a single candle's size may not be sufficient to adapt to all market conditions, especially when market structure changes.
Solutions:
- Consider adding additional filtering conditions, such as volume confirmation or trend strength indicators, to reduce false signals.
- For stop loss settings, consider using trailing stops or support/resistance-based stops, rather than relying solely on ATR.
- Implement time filters to avoid trading during high volatility periods at market open and close.
- Regularly backtest and optimize parameters to ensure strategy effectiveness in the current market environment.
Strategy Optimization Directions
-
Parameter Optimization:
- EMA period can be optimized according to different trading instruments and timeframes; more volatile instruments may require longer EMA periods.
- ATR multiplier can be adjusted based on market volatility characteristics; higher volatility markets may need larger multipliers to avoid premature stop losses.
- Risk-reward ratio can be adjusted according to personal risk preferences and market characteristics.
-
Add Market Environment Filters:
- Introduce volatility indicators such as Bollinger Band width, pausing trading or adjusting parameters in low volatility environments.
- Add trend strength indicators like ADX, only trading in clear trends.
-
Time Filtering:
- Implement trading time windows, avoiding high volatility periods at market open and close, as well as low activity periods during lunch hours.
- Consider trading restrictions before and after important economic data releases.
-
Stop Loss and Take Profit Optimization:
- Implement partial profit-taking mechanisms, with part of the position taking profit at closer targets and part pursuing further targets.
- Introduce trailing stops, automatically adjusting stop loss positions as prices move in favorable directions.
-
Multi-Timeframe Analysis Integration:
- Add higher timeframe trend confirmation, ensuring intraday trading direction aligns with the larger trend.
- Introduce shorter timeframe precise entry point confirmation.
The implementation of these optimization directions can significantly improve the robustness and profitability of the strategy, but care must be taken not to over-optimize leading to overfitting issues. Each improvement should be validated through rigorous backtesting and forward testing.
Conclusion
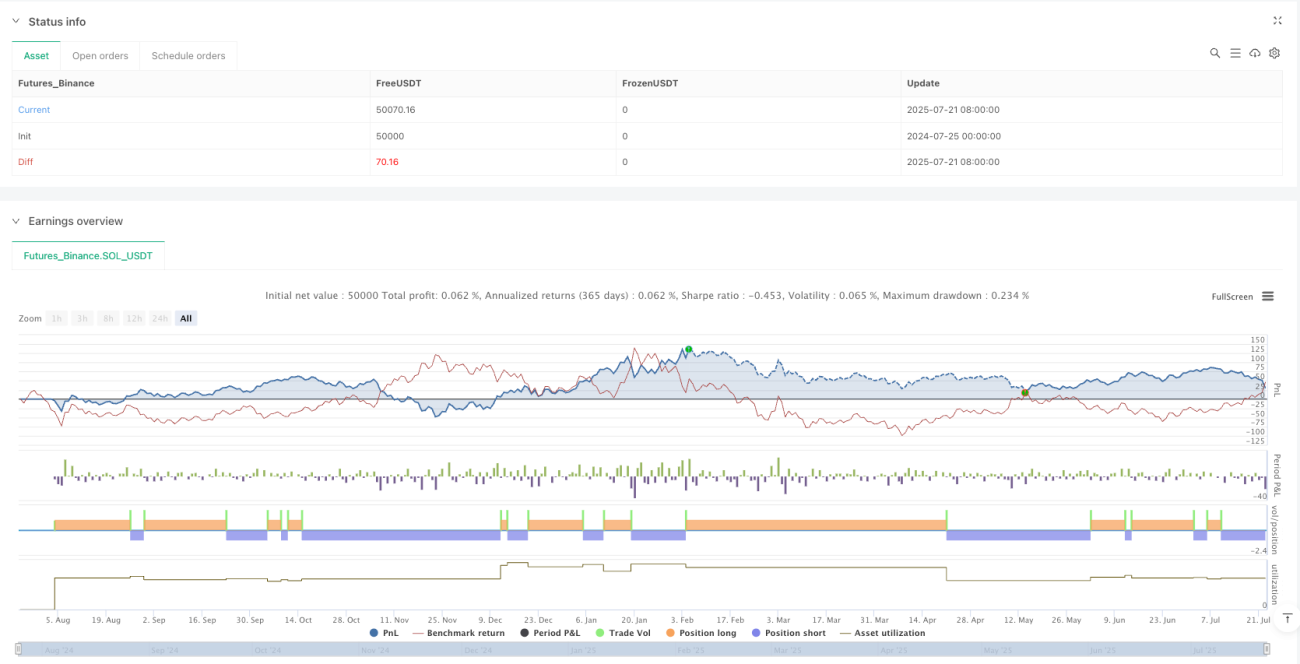
The Dynamic Dual-Moving Average Crossover Strategy with Typical Price Anchored VWAP and ATR-Based Risk Management is a comprehensive trading system combining multiple technical analysis tools. It identifies potential trading opportunities through the relationship between EMA 20 and VWAP calculated with typical price, and uses a dynamic risk management mechanism based on ATR and candle size to control risk and optimize returns.
The main advantage of the strategy lies in its ability to adapt to market volatility and the signal reliability provided by combining multiple technical indicators. However, it also faces risks such as moving average lag and overtrading, which need to be mitigated through additional filtering conditions and parameter optimization.
For intraday traders, this strategy provides a systematic trading framework, particularly suitable for those seeking to capture short-term market opportunities while maintaining reasonable risk control. Through continuous backtesting, optimization, and practice, traders can further refine this strategy according to their risk tolerance and trading objectives, turning it into a personalized, robust trading system.
- 1