
Overview
The Dynamic Break of Structure Quantitative Backtesting Strategy is a trading system based on Smart Money Concept (SMC) that focuses on identifying high-probability trend continuation and reversal entry signals. This strategy captures momentum shift points by monitoring market structure breakouts (Break of Structure, BOS), precisely timing entry opportunities. Designed with institutional-level trading logic, the system automatically identifies key structural turning points, combines candle momentum confirmation, and provides traders with clear entry signals and risk-controlled exit mechanisms. The core logic revolves around dynamic breakouts of price swing highs and lows, implementing a fully automated trading management process through fixed stop-loss points and adjustable risk-reward ratios. This strategy is particularly suitable for quantitative traders looking to backtest the effectiveness of institutional-level trading methods and can be applied across multiple timeframes, performing exceptionally well on 15-minute, 1-hour, and 4-hour charts.
Strategy Principles
The core principles of this strategy are based on market structure breakthrough theory, implemented through the following steps:
-
Structure High-Low Identification: The system uses the
ta.pivothighandta.pivotlowfunctions to dynamically identify price swing highs and lows according to user-defined sensitivity parameters. These highs and lows form the basic framework of market structure. -
Structure Breakthrough Detection: When price creates a new higher high (above the previous swing high) or lower low (below the previous swing low), the system identifies it as a structure breakthrough event. To prevent overtrading, the strategy sets a minimum spacing condition (
minGapBars), ensuring sufficient price development after a recent breakthrough. -
Momentum Confirmation Entry: After a structure breakthrough, the strategy requires momentum confirmation - long signals need closing prices higher than opening prices (bullish candles), while short signals need closing prices lower than opening prices (bearish candles). This confirmation step enhances trading accuracy.
-
Risk Management Mechanism: Each trade automatically sets a fixed point stop-loss (
slPips) and dynamically calculates profit targets based on user-defined risk-reward ratios (rr). For example, setting a 100-point stop-loss with a 2.0 risk-reward ratio will automatically calculate a 200-point profit target. -
Automatic Execution: The system uses TradingView's
strategy.entryandstrategy.exitfunctions to automatically execute trades when confirmed signals appear and set corresponding stop-loss and profit levels.
The core advantage of the strategy lies in combining the precision of technical analysis with the logic of institutional-level trading, capturing key momentum turning points through structure breakthroughs while protecting capital safety with a built-in risk management system.
Strategy Advantages
Through in-depth code analysis, this strategy demonstrates the following significant advantages:
-
Precise Entry Based on Market Structure: By identifying key structure breakthrough points, the strategy can capture the early stages of major trends, providing high-probability entry opportunities. Compared to traditional indicators, structure breakthroughs often identify trend changes earlier.
-
Momentum Confirmation Reduces False Breakouts: Requiring candle direction confirmation (bullish candles for longs, bearish candles for shorts) effectively filters out many potential false breakout signals, improving system reliability.
-
Comprehensive Backtesting Capability: Built using TradingView's strategy() functions, it allows complete historical backtesting, enabling traders to evaluate strategy performance under different market conditions, including key metrics such as win rate, profit-loss ratio, and maximum drawdown.
-
Automated Risk Management: Each trade automatically sets stop-loss and profit targets, ensuring consistency and discipline in fund management. The risk-reward ratio parameter allows traders to adjust the strategy according to personal risk preferences.
-
Cross-Timeframe Adaptability: Although optimized for 15-minute, 1-hour, and 4-hour timeframes, the strategy logic applies to any market and timeframe that respects structure, offering extreme flexibility.
-
Parameter Customizability: Users can adjust sensitivity, minimum spacing conditions, stop-loss points, and risk-reward ratios to adapt the strategy to different trading styles and market conditions.
-
Non-Repainting Signals: The strategy is based on confirmed price action, avoiding common indicator repainting issues and providing more reliable backtesting results.
Risk Analysis
Despite its many advantages, this strategy presents the following potential risks that require attention:
-
Poor Performance in Ranging Markets: In sideways markets lacking clear trends, structure breakthrough signals may lead to frequent false breakouts and stop-loss triggers, causing consecutive losses. In such market environments, consider temporarily disabling the strategy or adding additional trend filters.
-
Sensitivity Parameter Sensitivity: Setting the
sensitivityparameter too low will generate too many trading signals, while setting it too high might miss important turning points. Traders need to conduct optimization tests for specific markets and timeframes. -
Fixed Stop-Loss Risk: Using fixed point stop-losses rather than volatility-based or structure-based stops may result in stops that are too tight during high volatility periods and too wide during low volatility periods. Consider implementing adaptive stop-loss mechanisms to reduce this risk.
-
Over-Reliance on a Single Indicator: Relying solely on structure breakthroughs may ignore other important market factors such as volume, support/resistance levels, and fundamental influences. It's recommended to use this strategy as part of a more comprehensive trading system.
-
Parameter Over-Optimization Risk: Excessive parameter optimization during backtesting may lead to curve-fitting problems, causing strategy performance in live trading to be significantly lower than backtesting results. Use walk-forward testing and sufficiently long historical data to verify strategy robustness.
-
Capital Management Risk: The default use of a fixed percentage of funds (10%) for position management may not be suitable for all account sizes and risk tolerances. Traders should adjust this parameter according to their individual circumstances.
Optimization Directions
Based on code analysis, here are several key optimization directions for this strategy:
-
Add Volume Confirmation: Integrating volume analysis can significantly improve judgment of breakthrough validity. High-volume breakouts are typically more reliable, while low-volume breakouts may signal false breakthroughs. Consider adding volume breakthrough thresholds as additional entry filters.
-
Integrate Market Structure Shift: Beyond simple structure breakthroughs, identifying higher-level market structure shifts (such as higher lows turning into lower lows) can provide signals for larger trend changes, filtering out smaller-level structure breakthroughs to capture only more meaningful major trend opportunities.
-
Adaptive Risk Management: Dynamically adjusting stop-loss and profit targets based on market volatility (ATR) rather than using fixed points can better adapt to different market conditions. Use wider stops during high volatility periods and narrower stops during low volatility periods.
-
Add Multiple Timeframe Analysis (MTF): Integrating higher timeframe trend directions as trading filters, entering only when the current timeframe trend aligns with higher timeframe trends, can significantly improve strategy win rates.
-
Utilize Key Price Zones: Identify and integrate support/resistance zones, liquidity areas, or fair value gaps (FVG) as additional confirmation mechanisms, prioritizing structure breakthrough signals near these key areas.
-
Implement Profit Protection Mechanisms: Add trailing stops or partial position closing rules to lock in partial profits after price moves in a favorable direction, improving overall profitability and reducing drawdowns.
-
Major News Filtering: Set trading restriction zones before and after important economic data releases to avoid entering during extreme volatility periods, reducing risks from slippage and abnormal fluctuations.
-
Optimize Entry Timing: Consider waiting for pullbacks to key support/resistance levels after confirming structure breakthroughs before entering, to obtain better entry prices and smaller stop-loss distances.
Summary
The Dynamic Break of Structure Quantitative Backtesting Strategy is an advanced trading system based on SMC principles, focusing on market structure breakthroughs. Its core advantage lies in capturing key trend turning points, providing clear entry signals and automated risk management mechanisms. By combining swing high and low identification with momentum confirmation, the strategy effectively reduces the risk of false breakouts, providing traders with a reliable quantitative trading framework.
Nevertheless, this strategy has limited performance in ranging markets and faces limitations from parameter sensitivity and fixed stop-losses. By adding volume confirmation, integrating market structure shifts, implementing adaptive risk management, and multiple timeframe analysis, traders can significantly enhance the strategy's robustness and profitability.
Most importantly, this strategy should be viewed as an educational and research tool rather than an independent signal provider. Successful traders will use it as part of a more comprehensive trading approach, combining personal confirmation, market understanding, and strict risk management principles. Through continuous optimization and adaptation to different market environments, this quantitative strategy based on structure breakthroughs can become a powerful tool for capturing trend turning points.
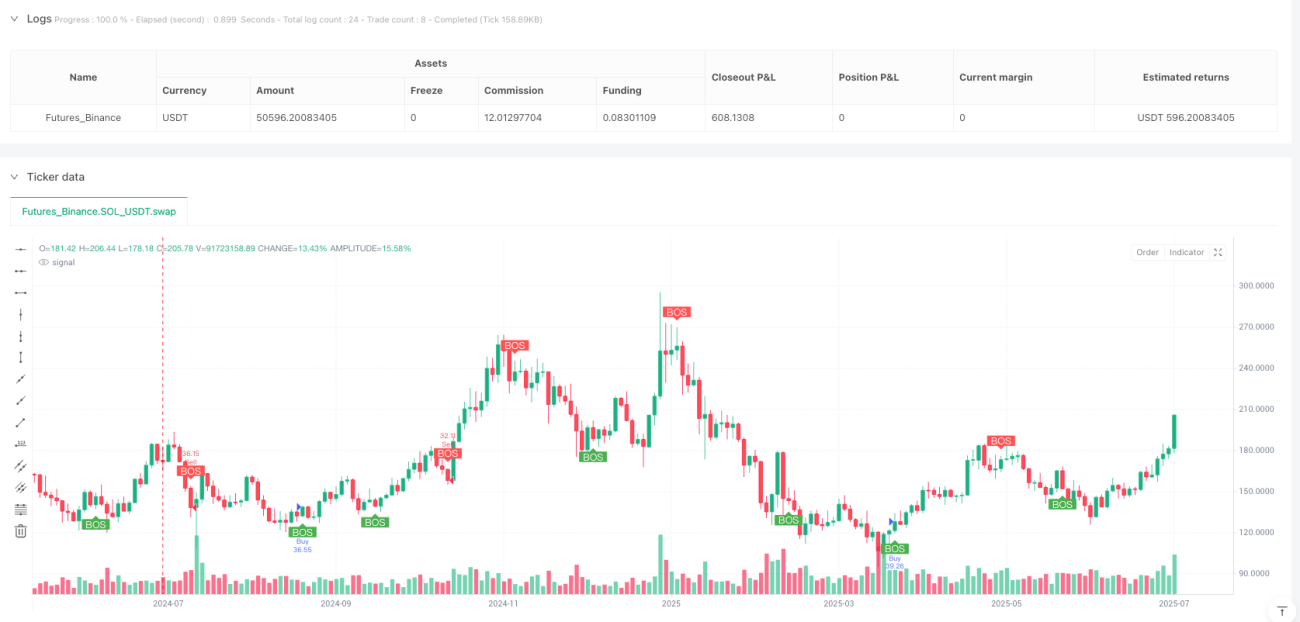
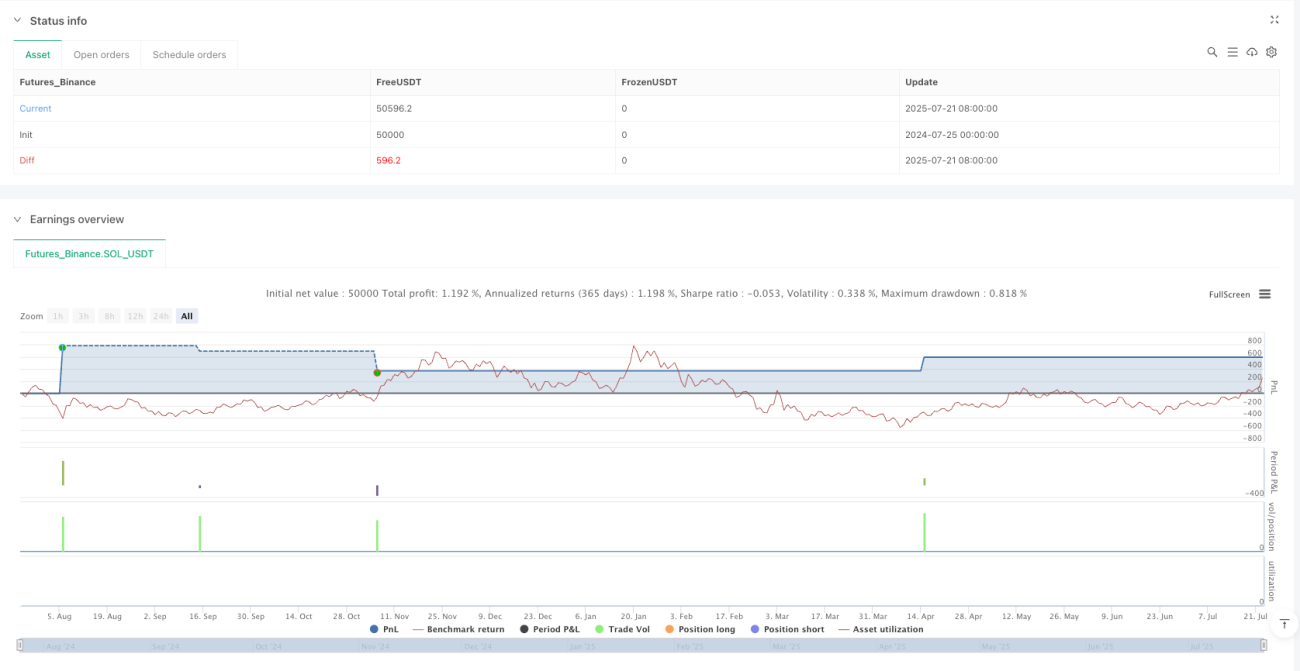
/*backtest
start: 2024-07-25 00:00:00
end: 2025-07-23 08:00:00
period: 2d
basePeriod: 2d
exchanges: [{"eid":"Futures_Binance","currency":"SOL_USDT"}]
*/

//@version=5
strategy("SMC BOS Strategy for XAUUSD", overlay=true, default_qty_type=strategy.percent_of_equity, default_qty_value=10)

// === USER INPUTS ===- 1