
Overview
The Multi-EMA Trend Filtering with ATR Trailing Stop Quantitative Strategy is a comprehensive trading system that combines several key elements of technical analysis. The core of this strategy lies in utilizing multiple Exponential Moving Averages (EMAs) as trend confirmation filters, while incorporating an Average True Range (ATR) indicator to establish a dynamic trailing stop system. The strategy also integrates a trading session filter functionality, allowing traders to optimize trade execution based on specific market active hours. By combining multiple technical indicators and filtering conditions, this strategy aims to capture strong trends and reduce the risk of false signals, while protecting profits and limiting potential losses.
Strategy Principles
The core principles of this strategy can be divided into four key components:
-
Multiple EMA Trend Confirmation: The strategy uses four different period Exponential Moving Averages (20, 50, 100, and 200) to determine market trend direction. An uptrend is only recognized when price is simultaneously above all four EMAs; a downtrend is only recognized when price is simultaneously below all four EMAs. This multiple confirmation mechanism helps filter out false signals in weak trends and ranging markets.
-
ATR Trailing Stop System: The strategy employs a dynamic trailing stop line based on the Average True Range (ATR). ATR is an indicator that reflects market volatility, and by multiplying it by a sensitivity coefficient (default 3.0), the stop distance is established. The trailing stop line automatically adjusts according to price movements, gradually moving up as prices rise and remaining fixed when prices fall, thereby locking in profits and limiting losses.
-
Price and Stop Line Crossover Signals: Buy signals are generated when price crosses above the ATR trailing stop line while meeting uptrend conditions; sell signals are generated when price crosses below the ATR trailing stop line while meeting downtrend conditions. This crossover signal mechanism, combined with trend confirmation, helps capture trend turning points.
-
Trading Session Filter: The strategy introduces a trading session filter functionality, defaulted to "0930-1600" (standard US trading hours). This filter ensures that trading signals are only generated during specified active trading sessions, avoiding potential risks of low liquidity or high volatility periods.
Strategy Advantages
-
Multi-layer Trend Confirmation: By requiring price to be simultaneously on the same side of four different period EMAs, the strategy significantly improves the reliability of trend confirmation, effectively filtering out false signals in ranging markets and reducing unnecessary trading frequency.
-
Dynamic Risk Management: The ATR trailing stop system automatically adjusts stop distances based on actual market volatility, meaning it provides more room for price movement in highly volatile markets and adopts tighter stops in less volatile markets, achieving dynamic risk adaptation.
-
High Customizability: The strategy provides multiple adjustable parameters, including ATR period, sensitivity coefficient, and trading session settings, allowing traders to optimize adjustments based on different market characteristics and personal risk preferences.
-
Time Filtering Optimization: The trading session filtering feature enables the strategy to focus on trading during the most active and liquid market periods, avoiding potential risks during pre-market, after-hours, or other low liquidity periods.
-
Intuitive Visual Feedback: The strategy clearly displays EMA lines, trailing stop lines, and buy/sell signals on the chart, while intuitively reflecting the relative position of current price to the stop line through bar color changes, facilitating real-time monitoring of strategy status by traders.
Strategy Risks
-
Trend Transition Delay: While multiple EMA filtering improves signal reliability, it also introduces a certain delay, potentially causing missed profit opportunities in the early stages of a trend or late exits at trend endings. This is an inevitable trade-off between reliability and timeliness.
-
Poor Performance in Ranging Markets: In ranging markets lacking clear trends, as price frequently crosses multiple EMAs, the strategy may struggle to meet all EMA filtering conditions, resulting in missed potential trading opportunities or excessive false signals.
-
Parameter Sensitivity: Strategy performance highly depends on key parameter settings such as ATR sensitivity coefficient and ATR period. Inappropriate parameters may lead to stops that are too tight (frequently triggered) or too loose (excessive losses). It is recommended to optimize these parameters through backtesting under different market conditions.
-
Event Risk: In cases of price gaps or violent fluctuations caused by major news or black swan events, ATR trailing stops may not respond in time, resulting in actual losses exceeding expectations. It is advisable to complement this with hard stops to limit maximum risk.
-
Overtrading Risk: Despite multiple filters, frequent crossovers between price and the ATR trailing stop line in highly volatile markets may still lead to overtrading, increasing transaction costs. Consider adding minimum holding time requirements to mitigate this issue.
Strategy Optimization Directions
-
Add Trend Strength Indicators: Currently, the strategy relies solely on the relative position of price to multiple EMAs to judge trends. Consider adding trend strength indicators such as ADX (Average Directional Index) and setting minimum trend strength thresholds to further filter signals in weak trend environments.
-
Introduce Volume Confirmation: Incorporate volume analysis into signal generation logic, requiring buy/sell signals to be accompanied by sufficient volume confirmation, which helps improve signal reliability. For example, require signal generation volume to be higher than the average volume of the past N periods.
-
Optimize Stop Parameter Adaptive Mechanism: The current strategy uses a fixed ATR sensitivity coefficient. Consider implementing an adaptive parameter adjustment mechanism based on historical volatility or market state. For example, automatically increase sensitivity coefficients in high-volatility markets and decrease them in low-volatility markets.
-
Add Profit Targets and Risk-Reward Ratio Filtering: Implement signal filtering mechanisms based on preset profit targets and risk-reward ratios, only executing trades where the expected risk-reward ratio exceeds a specific threshold. This helps optimize capital utilization efficiency and focus on high-quality trading opportunities.
-
Market State Classification and Strategy Switching: Implement automatic identification mechanisms for market states (trending/ranging) and dynamically adjust strategy parameters or switch different strategy logics based on different market states. For example, use the current strategy in clearly trending markets and switch to mean reversion strategies in ranging markets.
-
Integrate Fundamental Filters: For specific asset classes, consider integrating relevant fundamental indicators or event filters to avoid trading before and after important economic data releases or other high-uncertainty events.
Summary
The Multi-EMA Trend Filtering with ATR Trailing Stop Quantitative Strategy is a complete trading system that combines the advantages of trend following and risk management. By combining multiple period EMA trend confirmation, ATR dynamic trailing stops, price crossover signals, and trading session filtering, this strategy provides good risk control capabilities while capturing medium to long-term trends.
The main advantages of this strategy lie in multi-layer trend confirmation improving signal reliability, while ATR trailing stops provide dynamic risk management adapted to market volatility. However, the strategy also has potential risks such as trend transition delays, poor performance in ranging markets, and parameter sensitivity.
By adding trend strength indicators, volume confirmation, adaptive parameter mechanisms, and other optimization measures, this strategy has room for further improvement. Most importantly, traders should adjust key parameters through thorough backtesting based on specific trading instruments and market environments, and consider using this strategy as part of a larger trading system, combined with other complementary strategies, to achieve optimal results.
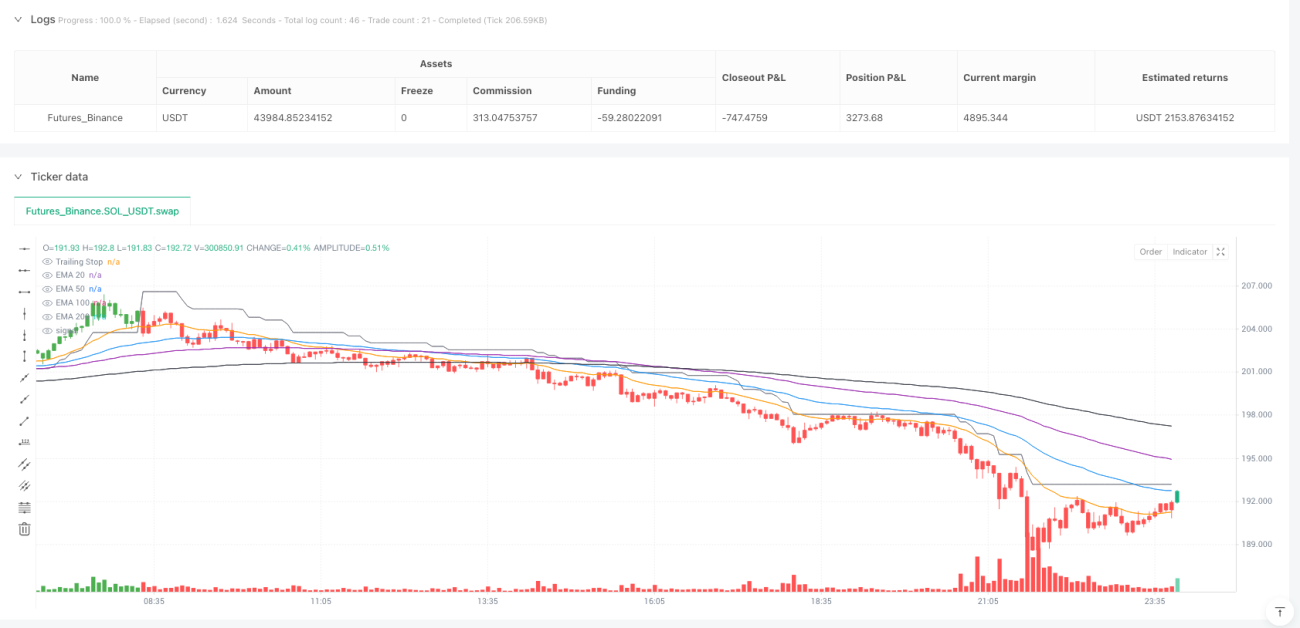
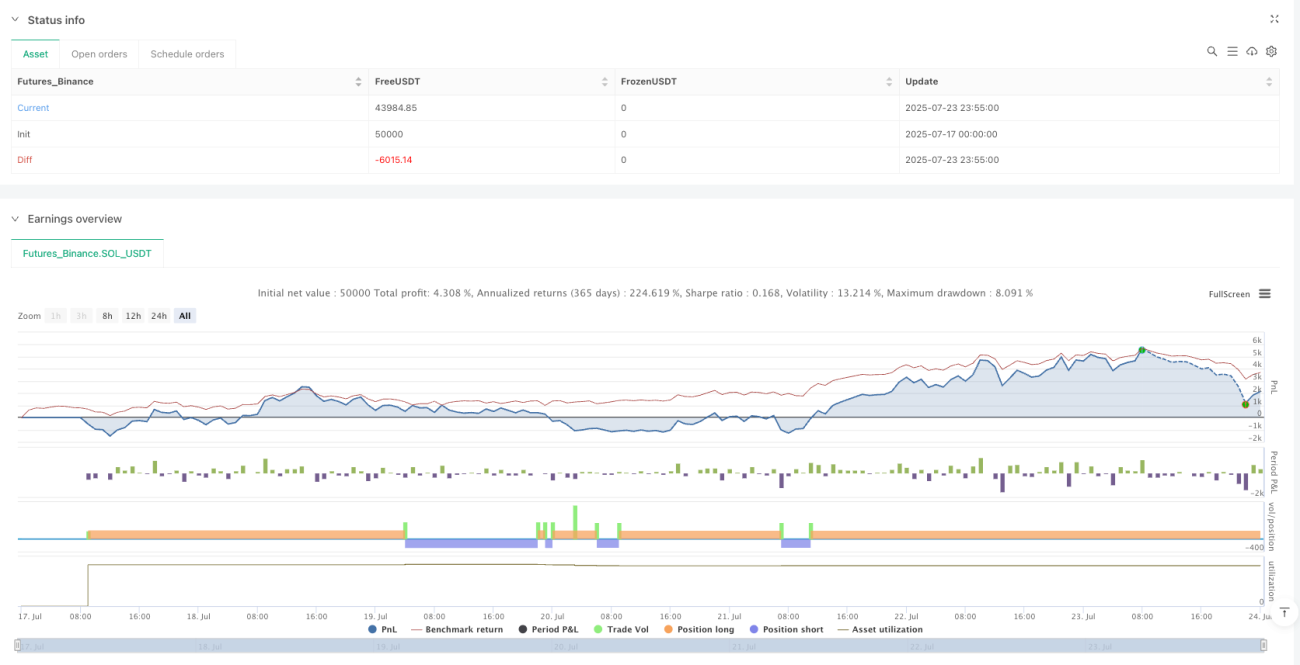
/*backtest
start: 2025-07-17 00:00:00
end: 2025-07-24 00:00:00
period: 5m
basePeriod: 5m
exchanges: [{"eid":"Futures_Binance","currency":"SOL_USDT"}]
*/

//@version=5
//Credits to HPotter who is the creator of the original code.
//Created as a strategy with an added EMA Trend Filter by shannonnhxrk
//Added a time button so you can adjust what times it signals.- 1