
Overview
The Dynamic Volatility-Adjusted Dual SMA Trend-Following Strategy is a quantitative trading system that combines technical indicators with dynamic risk management. The core approach utilizes crossover signals between fast and slow Simple Moving Averages (SMA), coupled with an Average Directional Index (ADX) filter to confirm trend strength, while dynamically adjusting stop-loss and take-profit levels through Average True Range (ATR) to maintain a fixed 2:1 risk-reward ratio. This methodology enables the strategy to adapt to different market conditions and timeframes, making it particularly effective for short-term trading on 5-minute and 15-minute charts.
Strategy Principles
The core logic of this strategy is based on several key technical components:
-
Entry Signal Generation: The system employs two Simple Moving Averages with different periods (default settings of 10 and 21 periods). When the fast SMA crosses above the slow SMA, the system generates a long signal; when the fast SMA crosses below the slow SMA, the system generates a short signal.
-
Trend Strength Confirmation: To avoid excessive false signals in non-trending or weak-trending markets, the strategy incorporates the ADX indicator as a filter. Only when the ADX value is greater than or equal to the set threshold (default 20) is the trade signal confirmed as valid. This ensures that the system only trades in market environments with clear directionality.
-
Dynamic Risk Management: The strategy employs ATR-based dynamic stop-loss and take-profit settings. The stop-loss point is set at 1x the current ATR value, while the take-profit point is set at 2x the stop-loss distance (adjustable through the risk-reward ratio parameter). This approach allows risk management to automatically adjust according to market volatility, setting wider stops in high-volatility markets and narrower stops in low-volatility markets.
-
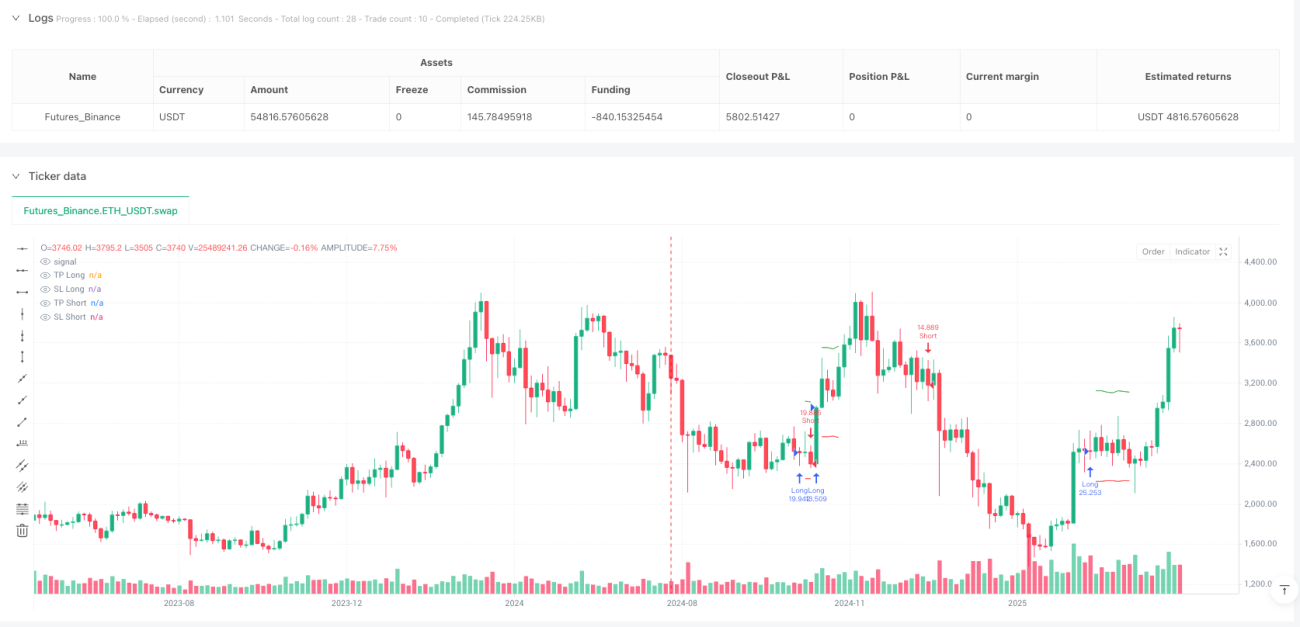
Visualized Risk Zones: The strategy visually displays stop-loss areas (red) and take-profit areas (green) on the chart through colored rectangles, helping traders clearly grasp the risk and potential reward of each trade.
In the code implementation, the strategy first calculates the required technical indicators (SMA, DMI, ADX, ATR), then generates trading signals based on the set conditions. Once a trading signal is confirmed, the system immediately sets the corresponding stop-loss and take-profit levels and displays the risk management zones on the chart.
Strategy Advantages
-
Strong Adaptability: By using ATR to dynamically adjust stop-loss and take-profit levels, the strategy can automatically adapt to the volatility characteristics of different markets, eliminating the need for parameter optimization for different trading instruments, greatly reducing the risk of overfitting.
-
Strict Risk Management: The preset fixed risk-reward ratio (default 2:1) ensures the possibility of long-term profitability; even with a moderate win rate, the strategy can profit in long-term trading as long as it maintains a positive expected value.
-
Trend Confirmation Mechanism: The ADX filter effectively reduces false breakouts and invalid signals, improving trade quality, especially in oscillating market environments.
-
Intuitive Visual Feedback: Through colored zones that visually display risk and potential reward, traders are helped to maintain discipline and not arbitrarily move stops or close positions prematurely due to emotional fluctuations.
-
Multi-Market Applicability: The strategy design considers the characteristics of different markets and can be applied to various financial products such as forex, cryptocurrencies, indices, or stocks without significant parameter adjustments.
-
Clean and Efficient Code: The strategy logic is clear, and the code implementation is concise, without complex calculations or conditional judgments, ensuring execution efficiency and backtesting speed.
-
No Repainting Issues: The indicators and signal generation methods used in the strategy do not have repainting problems, ensuring consistency between backtesting results and live performance.
Strategy Risks
Despite its sound design, the strategy still has the following potential risks:
-
SMA Lag: SMAs are inherently lagging indicators, which in volatile markets may cause entry signals to be delayed, missing optimal entry points or generating signals when a trend is already nearing its end. Solution: Consider adjusting SMA periods or introducing more sensitive indicators such as EMA (Exponential Moving Average) to reduce lag.
-
False Breakout Risk: Despite using the ADX filter, false breakouts may still occur under certain market conditions, especially during important news releases or in low-liquidity market environments. Solution: Additional confirmation indicators can be added, such as volume confirmation or price action pattern recognition.
-
Limitations of Fixed Risk-Reward Ratio: While a 2:1 risk-reward ratio performs well in most markets, it may result in premature profit-taking in strongly trending markets, failing to fully capture major trends. Solution: Implement partial position scaling out or introduce a dynamically adjusting risk-reward ratio.
-
ATR Volatility Risk: In extreme market conditions, ATR values may suddenly increase dramatically, causing stop-loss points to be too distant, increasing single-trade risk. Solution: Set maximum stop-loss limits or use a smoothed version of ATR to reduce the impact of extreme values.
-
Overtrading Risk: In oscillating markets, SMA crossovers may occur frequently, potentially leading to overtrading even with ADX filtering. Solution: Add trade interval restrictions or introduce stricter trend confirmation conditions.
Strategy Optimization Directions
Based on an in-depth analysis of the code, the strategy can be optimized in the following directions:
-
Entry Signal Optimization: Consider replacing Simple Moving Averages with Hull Moving Averages or VWAP (Volume-Weighted Average Price) indicators to reduce lag and improve signal quality. Such changes can allow the strategy to enter trends earlier, improving overall returns.
-
Multi-Timeframe Confirmation Mechanism: Introduce a multi-timeframe analysis framework requiring trade signals to be consistent across multiple timeframes. For example, execute trades only when daily, 4-hour, and 1-hour charts all show the same trend direction. This optimization can significantly reduce false breakouts and erroneous signals.
-
Dynamic Position Sizing: Dynamically adjust position size based on market volatility and trend strength, increasing position size when high-confidence signals appear and reducing position size when low-confidence signals appear. This approach can more effectively utilize capital, maximizing returns on high-quality trading opportunities.
-
Take-Profit Strategy Improvement: Implement a stepped take-profit or trailing stop mechanism, allowing profits to run in strong trend markets while protecting realized profits. Specifically, when reaching a 1:1 risk-reward ratio, move the stop-loss to breakeven, then let the remaining position continue until a trend reversal signal appears.
-
Market Environment Adaptability: Add a market type recognition module to automatically distinguish between trending and oscillating markets, adjusting strategy parameters or trading logic according to different market environments. For example, higher ADX thresholds and more conservative risk-reward settings may be needed in oscillating markets.
-
Machine Learning Enhancement: Consider introducing simple machine learning algorithms to classify successful and failed trades in historical data, thereby identifying optimal trading condition combinations and prioritizing similar trading opportunities in future trading.
-
Backtesting Robustness Improvement: Add realistic trading factors such as slippage, commissions, and liquidity constraints to ensure that strategy performance in live trading environments is consistent with backtesting results.
Summary
The Dynamic Volatility-Adjusted Dual SMA Trend-Following Strategy represents a quantitative trading approach that balances simplicity and effectiveness. By combining classic technical analysis indicators (SMA, ADX, ATR) with modern risk management principles, the strategy can maintain stable performance under different market conditions. Its core advantages lie in its ability to dynamically adapt to market volatility and its strict risk control mechanisms, ensuring that each trade follows preset risk-reward standards.
While the strategy has some inherent limitations, such as SMA lag and fixed risk-reward ratio constraints, these issues can be effectively improved through the optimization directions proposed in this article. In particular, significant improvements in strategy profitability and stability can be achieved by introducing multi-timeframe confirmation, dynamic position management, and improved take-profit strategies.
For traders, this strategy provides a reliable trading framework that is both simple to understand and sufficiently flexible. By adjusting core parameters (SMA periods, ADX threshold, risk-reward ratio), traders can customize the strategy according to personal risk preferences and trading objectives. Most importantly, the strategy's visual feedback mechanism helps cultivate good trading habits and discipline, which are key factors for long-term trading success.
/*backtest
start: 2024-07-28 00:00:00
end: 2025-07-26 08:00:00
period: 4d
basePeriod: 4d
exchanges: [{"eid":"Futures_Binance","currency":"ETH_USDT"}]
*/

//@version=6
strategy("Infalible Universal 2:1 Estrategia", overlay=true, margin_long=100, margin_short=100, default_qty_type=strategy.percent_of_equity, default_qty_value=100)

// === PARÁMETROS ===- 1