
Overview
The Dual Moving Average Momentum Trading Strategy (EMA 20/50 Crossover System) is a trend-following strategy based on technical analysis that uses crossover points between two exponential moving averages (EMAs) of different periods to generate buy and sell signals. The core logic of this strategy is that when the short-term EMA (20-period) crosses above the long-term EMA (50-period), it generates a buy signal, indicating a potential uptrend; when the short-term EMA crosses below the long-term EMA, it generates a sell signal, indicating a potential downtrend. The strategy also integrates optional stop-loss and take-profit features to limit risk per trade and lock in profits.
Strategy Principles
The core principle of this strategy is to capture market trend changes by comparing moving averages of different time periods. The specific implementation is as follows:
-
EMA Calculation:
- Fast EMA (emaFast): 20-period exponential moving average
- Slow EMA (emaSlow): 50-period exponential moving average
-
Signal Generation Mechanism:
- Buy signal (longEntry): Triggered when the fast EMA crosses above the slow EMA
- Sell signal (longExit): Triggered when the fast EMA crosses below the slow EMA
-
Trade Execution:
- When a buy signal appears, the system enters a long position
- When a sell signal appears, the system closes the long position
-
Risk Management:
- Optional stop-loss/take-profit feature: Users can set percentage-based stop-loss (default 2%) and take-profit (default 4%)
- Trading commission set at 0.05%
- Initial capital set at 100,000
- Pyramiding disabled (pyramiding=0)
- Orders processed at close (process_orders_on_close=true)
-
Visualization:
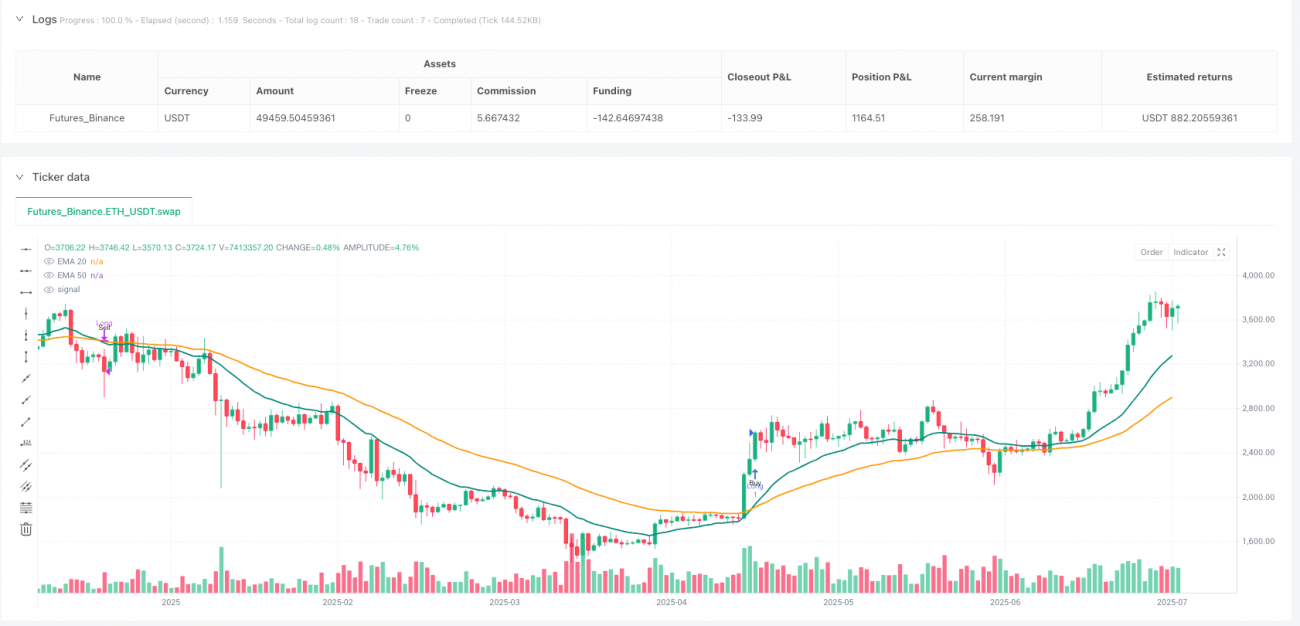
- Plots 20-period EMA (teal) and 50-period EMA (orange) on the chart
- Buy signals displayed as green upward triangles, sell signals as red downward triangles
Strategy Advantages
-
Simple and Effective: The strategy logic is straightforward, easy to understand and implement, without complex parameter adjustments, making it suitable for beginners.
-
Trend-Following Capability: EMAs respond relatively sensitively to price changes, and the crossover of two moving averages effectively captures medium to long-term trend shifts, helping to follow major market trends.
-
Filters Market Noise: Using 20 and 50-period EMAs filters short-term market fluctuations, reducing false signals and improving the reliability of trading signals.
-
Flexible Risk Management: The strategy offers optional stop-loss and take-profit features, allowing users to adjust risk parameters according to their risk preferences and market conditions.
-
Automated Execution: The fully programmed strategy can automatically monitor the market and execute trades, eliminating emotional trading decisions and maintaining trading discipline.
-
Clear Visualization: The strategy displays trading signals and moving average trends intuitively on the chart, facilitating analysis and verification of strategy effectiveness.
-
Alert Functionality: Built-in alert conditions that can trigger reminders when buy or sell signals appear, allowing traders to be promptly aware of trading opportunities.
Strategy Risks
-
Lag Issue: As a trend-following strategy, EMAs inherently have lag, which may cause missed optimal entry or exit points during the initial phase of trend reversals, especially in violently fluctuating markets.
-
Poor Performance in Ranging Markets: In sideways or oscillating markets, moving average crossover strategies tend to produce frequent false signals, leading to consecutive losing trades.
-
Capital Management Risk: Although the strategy includes a stop-loss feature, fixed percentage stops may not be suitable for all market environments and could lead to premature exits in highly volatile markets.
-
Parameter Sensitivity: The 20/50 period EMA combination may not be suitable for all markets and timeframes, requiring parameter optimization for specific markets.
-
Commission Impact: In cases of frequent trading, the 0.05% trading commission may significantly affect overall returns, especially in trades with small profits.
-
Single Signal Source: The strategy relies solely on EMA crossovers as trading signals, lacking confirmation from other technical indicators or fundamentals, which may increase the risk of false signals.
Strategy Optimization Directions
-
Add Filtering Conditions: Consider combining other technical indicators such as RSI, MACD, or volume indicators to build a multi-confirmation system and reduce false signals. For example, add conditions requiring RSI to show overbought or oversold conditions, or require significant volume increase when signals appear.
-
Dynamic Stop-Loss Mechanism: Replace fixed percentage stop-losses with trailing stops or volatility-based dynamic stops (such as ATR indicator) to adapt to different market environments.
-
Optimize Entry Timing: Consider waiting for pullbacks after moving average crossovers, or combine candlestick pattern analysis to obtain better entry prices and higher win rates.
-
Add Time Filters: Add trading time window restrictions to avoid low liquidity or high volatility periods, such as market opening and pre-closing volatile times.
-
Parameter Adaptation: Implement adaptive adjustment of EMA periods based on market volatility, dynamically adjusting moving average parameters to better suit different market environments.
-
Position Size Management: Introduce volatility-based position sizing, reducing positions in high-volatility markets and increasing positions in low-volatility markets to optimize risk-reward ratios.
-
Market Environment Filtering: Add market environment recognition mechanisms, such as using long-term moving averages to determine the direction of the main trend and only trading in the direction that aligns with the primary trend.
-
Backtest Optimization: Conduct comprehensive backtesting for different markets and timeframes to find optimal parameter combinations and evaluate strategy performance under various market conditions.
Summary
The Dual Moving Average Momentum Trading Strategy (EMA 20/50 Crossover System) is a classic technical analysis trading method that identifies market trend changes and executes trades by capturing crossover signals between 20-period and 50-period EMAs. The strategy is simple and intuitive, easy to implement and monitor, particularly suitable for medium to long-term trend following.
The main advantages of the strategy lie in its concise logic and effective capture of medium to long-term trends, while also offering flexible risk management options. However, as a moving average crossover strategy, it also faces inherent risks of signal lag and poor performance in oscillating markets.
To improve the robustness and adaptability of the strategy, traders are advised to consider adding additional filtering conditions, optimizing stop-loss mechanisms, and adjusting parameters according to specific market characteristics. Additionally, using this strategy as part of a more comprehensive trading system, combined with other technical or fundamental analyses, may achieve better overall results.
Nonetheless, before applying this strategy in practice, traders should conduct thorough backtesting and simulated trading to understand the strategy's performance characteristics in different market environments and make appropriate adjustments according to individual risk tolerance and investment objectives.
/*backtest
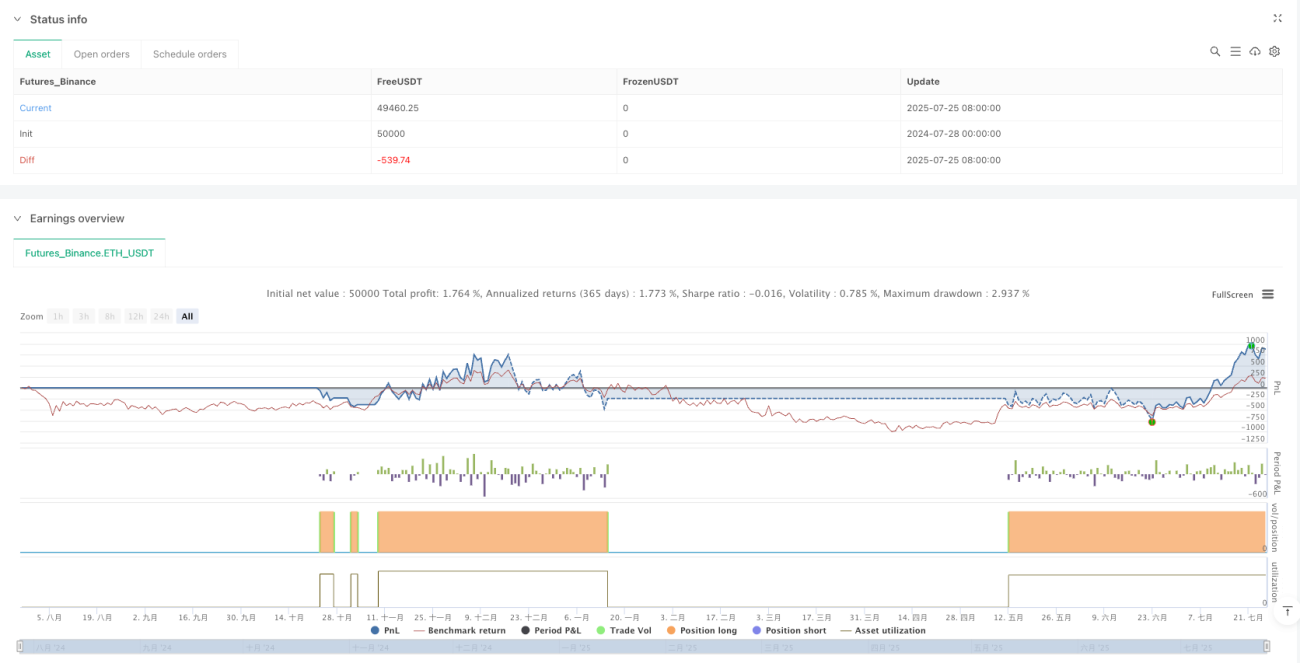
start: 2024-07-28 00:00:00
end: 2025-07-26 08:00:00
period: 1d
basePeriod: 1d
exchanges: [{"eid":"Futures_Binance","currency":"ETH_USDT"}]
*/
//@version=6
strategy("EMA 20/50 Crossover Strategy v6", overlay=true, initial_capital=100000, commission_type=strategy.commission.percent, commission_value=0.05, pyramiding=0, process_orders_on_close=true)
//-------------------------- 1