
Overview
The Multi-Indicator Dynamic Volatility Breakout Strategy is a comprehensive quantitative trading system that combines Heikin Ashi smoothed candlesticks, Moving Average (MA), and Money Flow Index (MFI) for signal generation, while utilizing Average True Range (ATR) for dynamic risk management parameters. The core of this strategy lies in capturing price crossovers with the moving average, reducing market noise through Heikin Ashi candlesticks, and enhancing signal quality with optional MFI momentum confirmation. Additionally, the strategy is equipped with a flexible stop-loss management system, including break-even and trailing stop functionalities, allowing traders to maximize profit potential while protecting capital.
Strategy Principles
The strategy operates based on the following key components:
-
Signal Generation Mechanism:
- Long Entry: Triggered when Heikin Ashi close crosses above the MA, or when MFI is below 20 and Heikin Ashi close is above the MA
- Short Entry: Triggered when Heikin Ashi close crosses below the MA, or when MFI is above 90 and Heikin Ashi close is below the MA
-
Risk Management System:
- Stop Loss: Set based on ATR multiplied by a user-defined risk multiplier
- Take Profit: Set based on ATR multiplied by a user-defined reward multiplier
- Break-Even Mechanism: When price moves in favorable direction by a predefined multiple of ATR, stop loss moves to entry price
- Trailing Stop: After reaching break-even point, stop loss follows price movement by a specific multiple of ATR
-
Technical Indicator Application:
- Heikin Ashi Candlesticks: Smooth price action to reduce noise, providing clearer trend view
- Simple Moving Average: Determines market trend direction
- Average True Range: Dynamically adjusts stop loss and take profit levels based on market volatility
- Money Flow Index: Serves as an additional momentum filter to enhance entry signal reliability
-
Trade Management Logic:
- Dynamic updating of stop loss prices
- Adaptive adjustment of risk parameters based on market volatility
- Visualization of trade zones and key price levels
The strategy implementation includes multiple user-configurable parameters, including MA period, ATR period, MFI period, risk and reward multipliers, and break-even and trailing stop trigger conditions, making it highly customizable.
Strategy Advantages
After deep analysis of the code, this strategy demonstrates the following significant advantages:
-
Noise Filtering: Using Heikin Ashi candlesticks instead of traditional candlesticks significantly reduces market noise, improving signal quality and accuracy, avoiding false breakouts.
-
Dynamic Risk Management: ATR-based stop loss and take profit settings allow the strategy to adapt to volatility changes in different market conditions, avoiding the problem of fixed-point stops being triggered too early in high-volatility markets.
-
Flexible Break-Even and Trailing Mechanisms: Once a trade develops favorably to predetermined conditions, the break-even mechanism eliminates loss risk, while trailing stops can lock in profits while allowing trends to continue developing, effectively balancing risk and reward.
-
Multiple Confirmation System: Combining price action (MA crossover) and momentum indicator (MFI) for trade confirmation reduces the possibility of false signals, improving the win rate of trades.
-
Comprehensive Visual Feedback: The strategy provides clear visual elements, including trade zone shading, entry and exit markers, and key price level lines, allowing traders to intuitively understand market conditions and strategy execution.
-
High Customizability: Through multiple adjustable parameters, traders can tune strategy performance according to different market environments and personal risk preferences, adapting to different trading instruments and timeframes.
-
Integrated Dashboard: The built-in trading performance dashboard provides real-time profit/loss status and statistics, facilitating quick assessment of strategy performance and necessary adjustments.
Strategy Risks
Despite its sophisticated design, the strategy still presents the following potential risks:
-
Parameter Sensitivity: Strategy performance is highly dependent on parameter settings such as MA, ATR, and MFI periods. Inappropriate parameters may lead to overtrading or missing important opportunities. It is recommended to optimize these parameters through backtesting in different market environments.
-
Trend Change Adaptability: In ranging or rapidly reversing markets, MA crossover-based signals may produce lag, resulting in suboptimal entry points or triggering frequent false signals. Consider adding a trend strength filter to mitigate this risk.
-
Volatility Anomalies: During extreme market events, ATR may spike dramatically, causing stop loss and take profit targets to be set too wide, increasing per-trade risk. Implementing ATR value caps or dynamic multiplier adjustments can address this situation.
-
Over-reliance on Technical Indicators: The strategy is entirely based on technical indicators, ignoring fundamental factors and market structure. It may perform poorly during important news releases or market structure changes. Consider pausing the strategy before major events or integrating event risk filters.
-
Optimization Trap: With multiple adjustable parameters, the strategy is susceptible to over-optimization (curve fitting), making it perform worse in live trading than in backtests. Forward testing and multi-instrument validation should be used to evaluate strategy robustness.
-
Execution Risk: In less liquid markets or during high volatility periods, slippage and execution delays may be encountered, affecting actual entry and exit prices. Consider adding liquidity filtering conditions and accounting for execution delay factors.
Optimization Directions
Based on code analysis, the strategy can be optimized in the following directions:
-
Trend Strength Filtering: Integrate ADX (Average Directional Index) or similar indicators to assess trend strength, only entering positions in strong trend markets, reducing false signals in ranging markets. This can improve the precision and win rate of the strategy.
-
Multi-Timeframe Analysis: Introduce higher timeframe trend confirmation to ensure trade direction aligns with the major trend. For example, only trading hourly charts in the direction of the daily trend can significantly increase success rates.
-
Dynamic Parameter Adjustment: Implement mechanisms to automatically adjust MA length, ATR multipliers, and MFI thresholds based on market states (such as volatility, volume, or trend strength), allowing the strategy to better adapt to different market environments.
-
Volume Confirmation: Add volume analysis as an additional signal filter, only executing trades when supported by volume, which can increase signal reliability, especially at key breakout points.
-
Intelligent Money Management: Implement functionality to dynamically adjust position sizes based on account size, historical volatility, and recent trading performance, optimizing risk-reward ratios and overall profitability.
-
Machine Learning Enhancement: Utilize machine learning algorithms to optimize entry timing or predict optimal parameter combinations, especially for parameter adjustments across different market environments, improving strategy adaptability.
-
Sentiment Indicator Integration: Add market sentiment indicators (such as VIX, fear index, or social media sentiment analysis) to adjust trading behavior during extreme market sentiment, avoiding opening positions under unfavorable conditions.
-
Time Filters: Implement time-based trading filters to avoid market sessions with excessive volatility or insufficient liquidity, such as before and after important economic data releases or during market opening and closing periods.
Conclusion
The Multi-Indicator Dynamic Volatility Breakout Strategy is a comprehensive, flexible, and feature-rich quantitative trading system that captures trend changes and breakout opportunities while effectively filtering market noise through the combination of Heikin Ashi candlesticks, moving average crossovers, and the Money Flow Index. Its ATR-based dynamic risk management system, including break-even and trailing stop functionalities, provides robust capital protection mechanisms while optimizing profit potential.
The strategy is best suited for markets with distinct trends and can operate across multiple timeframes, though it performs better on assets with stable volatility. While potential risks exist in parameter sensitivity and market adaptability, these can be addressed through the suggested optimization directions, such as adding trend strength filtering, multi-timeframe analysis, and intelligent money management, further enhancing the strategy's robustness and adaptability.
Overall, this is a well-designed strategy framework that combines key elements of signal generation, risk management, and visual feedback, providing quantitative traders with a reliable trading tool capable of achieving consistent positive returns under appropriate market conditions and parameter settings.
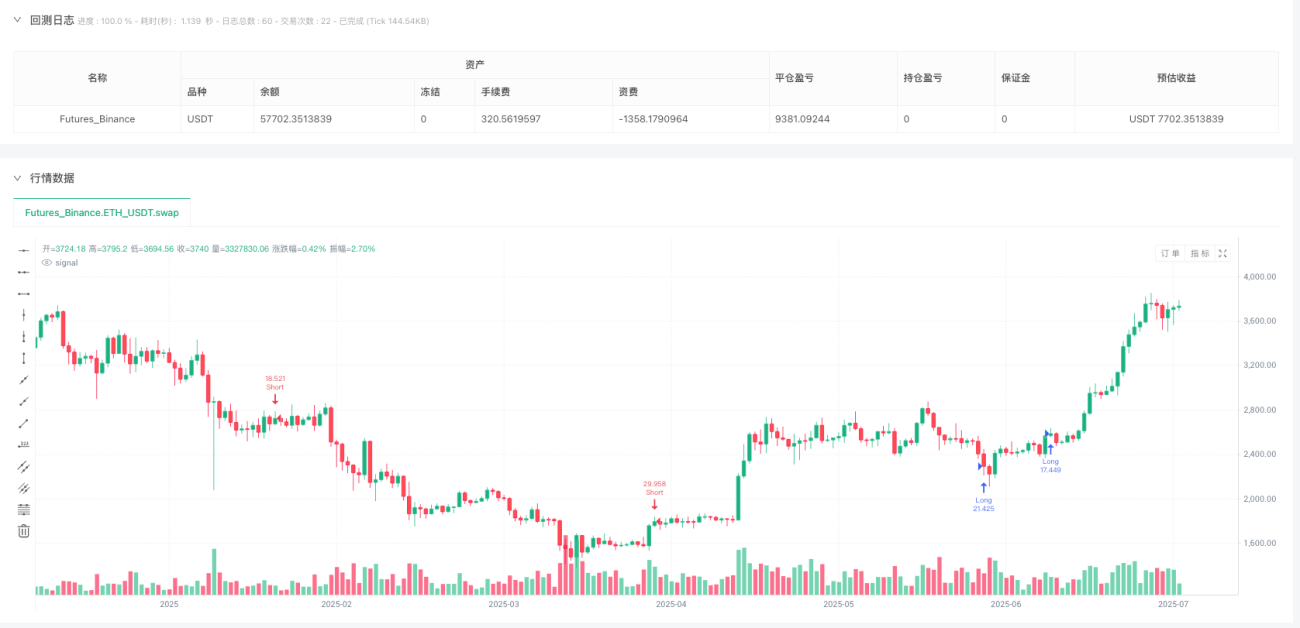
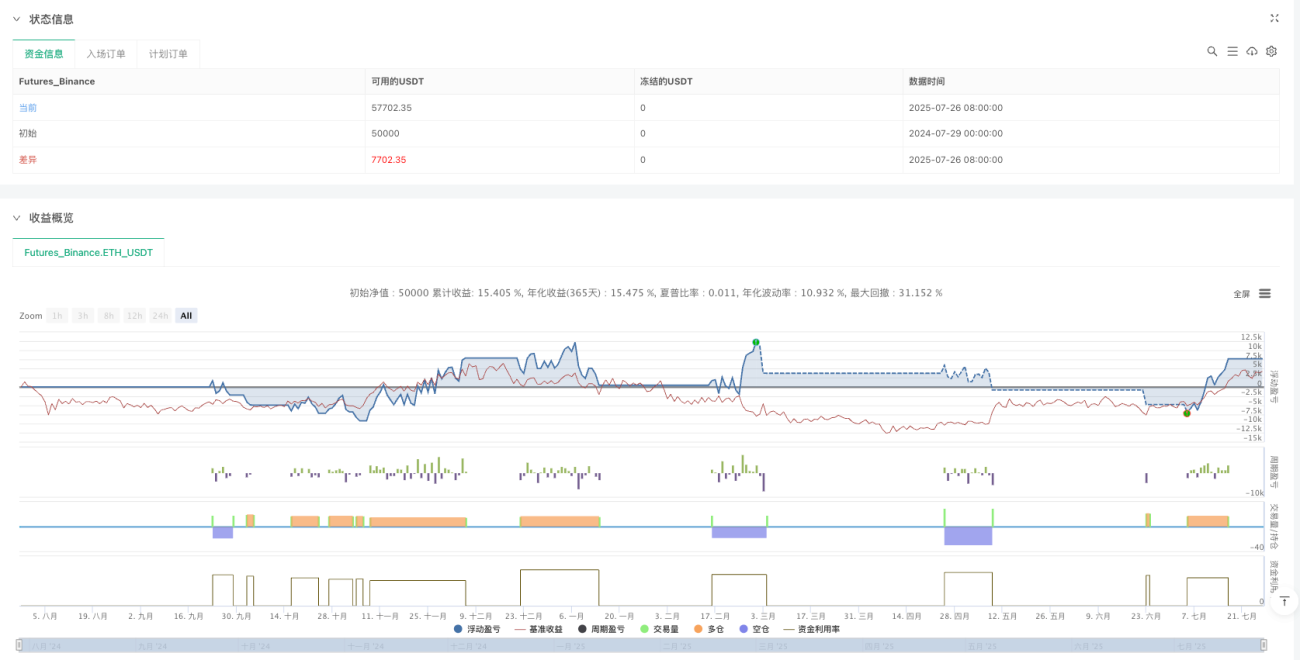
/*backtest
start: 2024-07-29 00:00:00
end: 2025-07-27 08:00:00
period: 1d
basePeriod: 1d
exchanges: [{"eid":"Futures_Binance","currency":"ETH_USDT"}]
*/

//@version=5
strategy("MVO - MA Signal Strategy", overlay=true, default_qty_type=strategy.percent_of_equity, default_qty_value=100)
inDateRange = true
source = close- 1