
Overview
This strategy is an advanced trading system based on Smart Money Concepts (SMC), specifically designed for the gold market (XAUUSD), primarily utilizing two key indicators: Fair Value Gaps (FVG) and Break of Structure (BoS). Implemented through the TradingView platform, this strategy not only automatically identifies imbalance zones and structural changes in the market but also executes trade entries and exits based on these signals. The strategy includes built-in backtesting functionality, allowing traders to validate its effectiveness before practical application, while also providing risk control mechanisms to ensure each trade follows preset risk-reward ratios. This combination method aims to capture imbalances between institutional buying and selling activities and provide clear directional bias at trend turning points.
Strategy Principles
The core principles of this strategy are based on two key Smart Money Concepts:
-
Fair Value Gaps (FVG): These are imbalance zones left when market prices move rapidly. Such zones typically attract price regression or become reversal areas. The strategy identifies these gaps by comparing current prices with historical prices and sets a minimum gap size parameter to filter out minor fluctuations.
-
Break of Structure (BoS): This refers to positions where price breaks through significant highs or lows, indicating potential market direction changes. The strategy uses a lookback parameter to determine structural importance and identifies breakthrough points by comparing current prices with historical price structures.
When FVG and BoS signals appear simultaneously under specific conditions and meet the cooldown period requirements, the strategy triggers a trading signal. Each trade automatically applies stop-loss and take-profit levels based on the user-input risk-reward ratio. To enhance visual clarity, the strategy also implements signal spacing functionality to avoid chart congestion.
From a code implementation perspective, the strategy first defines key parameters such as minimum FVG size, structure lookback period, risk-reward ratio, and trade intervals. It then calculates price structure highs and lows, identifies FVG and BoS signals, and applies spacing rules to improve visual clarity. Finally, the strategy manages trade entries and exits, sets stop-loss and take-profit levels, and provides visual markers to indicate trading signals.
Strategy Advantages
This strategy offers the following significant advantages:
-
Focus on Institutional Behavior: By tracking FVG and BoS, the strategy can capture market imbalances left by institutional investors, which are often indicators of high-probability trading opportunities.
-
Visual Clarity: The strategy employs signal spacing display functionality to avoid signal overcrowding, keeping charts clear and readable, particularly suitable for highly volatile markets like gold.
-
Integrated Risk Management: Built-in risk-reward settings and stop-loss mechanisms ensure each trade has predefined risk control, which is crucial for long-term trading success.
-
Flexibility and Customizability: Users can adjust multiple parameters according to personal trading styles, including FVG size, structure lookback period, spacing settings, etc., adapting the strategy to different market conditions and trading cycles.
-
Cooldown System: By implementing trade interval cooling periods, the strategy effectively prevents overtrading, especially during highly volatile market periods, which helps improve overall trading quality.
-
Combination of Real-time and Historical Analysis: The strategy provides not only real-time signals but also displays signals on historical data, facilitating trader review and learning of market behavior patterns.
-
Price Action Based: The strategy is entirely based on price action without relying on traditional indicators, making it relatively stable across different market environments.
Strategy Risks
Despite its many advantages, the strategy also has some potential risks:
-
False Breakout Risk: Markets may produce false structure breakouts, leading to incorrect trading signals. The solution is to add confirmation conditions, such as requiring post-breakout persistence or combining with other technical indicators.
-
Parameter Sensitivity: Strategy performance is highly dependent on parameter settings, such as FVG size and structure lookback period. Improper parameters may lead to overfitting or missing signals. It's recommended to optimize parameters through extensive historical data testing.
-
High Volatility Market Risk: In extremely volatile markets, FVGs may be too large or too small, affecting signal quality. Consider adding dynamic FVG size calculations that automatically adjust based on market volatility.
-
Timeframe Dependence: The strategy performs best in specific timeframes (such as 4-hour, 1-hour, or 15-minute) and may be less effective in other timeframes. It's advisable to clarify suitable timeframes before use.
-
Cooldown Period Setting Risk: Too long a cooldown period may miss good trading opportunities, while too short a period may lead to overtrading. This parameter needs adjustment based on market conditions and personal trading style.
-
Single Market Dependence: Although designed specifically for the gold market, excessive reliance on a single market may increase risk. Consider testing its applicability in other markets or using it as part of a multi-market strategy portfolio.
Strategy Optimization Directions
Based on an in-depth analysis of the code, here are possible optimization directions for this strategy:
-
Signal Quality Enhancement:
- Add additional confirmation conditions, such as requiring FVG and BoS signals to appear simultaneously within a certain timeframe
- Introduce volume analysis to confirm the validity of structure breakouts
- Consider the relationship between price and moving averages as trend confirmation
-
Dynamic Parameter Adjustment:
- Implement adaptive FVG size calculations based on market volatility
- Automatically adjust structure lookback periods based on different timeframes
- Introduce dynamic risk-reward ratios that adjust based on market conditions
-
Strategy Logic Refinement:
- Refine the current temporary trading logic to be fully based on FVG and BoS signals
- Add trend direction filters to ensure trading direction aligns with the main trend
- Implement partial profit-locking mechanisms that move stop-loss after achieving certain profits
-
Advanced Risk Management:
- Add fund management rules to dynamically adjust position sizes based on account size and market volatility
- Implement ATR (Average True Range) based stop-loss calculations to better adapt to current market volatility
- Include maximum daily loss and maximum consecutive loss controls
-
Multi-timeframe Analysis:
- Introduce multi-timeframe confirmation, requiring higher timeframe trends to support the current trading direction
- Develop timeframe coordination mechanisms to integrate signals from different timeframes
Implementing these optimization suggestions can significantly enhance the strategy's robustness and adaptability, reduce false signals, improve profitability, and strengthen risk management capabilities.
Conclusion
The Gold Market Smart Money Concept Equilibrium Breakthrough Strategy is an advanced trading system combining Fair Value Gaps (FVG) and Break of Structure (BoS), specifically designed to capture institutional behavior and price imbalances in the gold market. The strategy provides high-probability trade entry signals by identifying imbalance zones and structural change points in the market, while incorporating built-in risk management functions to ensure trades are executed under controlled risk.
The strategy's main advantages lie in its focus on institutional behavior, clear visual presentation, built-in risk management, and high customizability. However, users need to be aware of potential risks such as false breakout risks, parameter sensitivity, and market condition adaptability.
Through the optimization directions proposed in this article, such as signal quality enhancement, dynamic parameter adjustment, strategy logic refinement, advanced risk management, and multi-timeframe analysis, the strategy can further improve its performance across various market environments. Ultimately, this strategy provides traders with a systematic trading framework based on price action and institutional behavior, with the potential to achieve stable results in long-term trading.
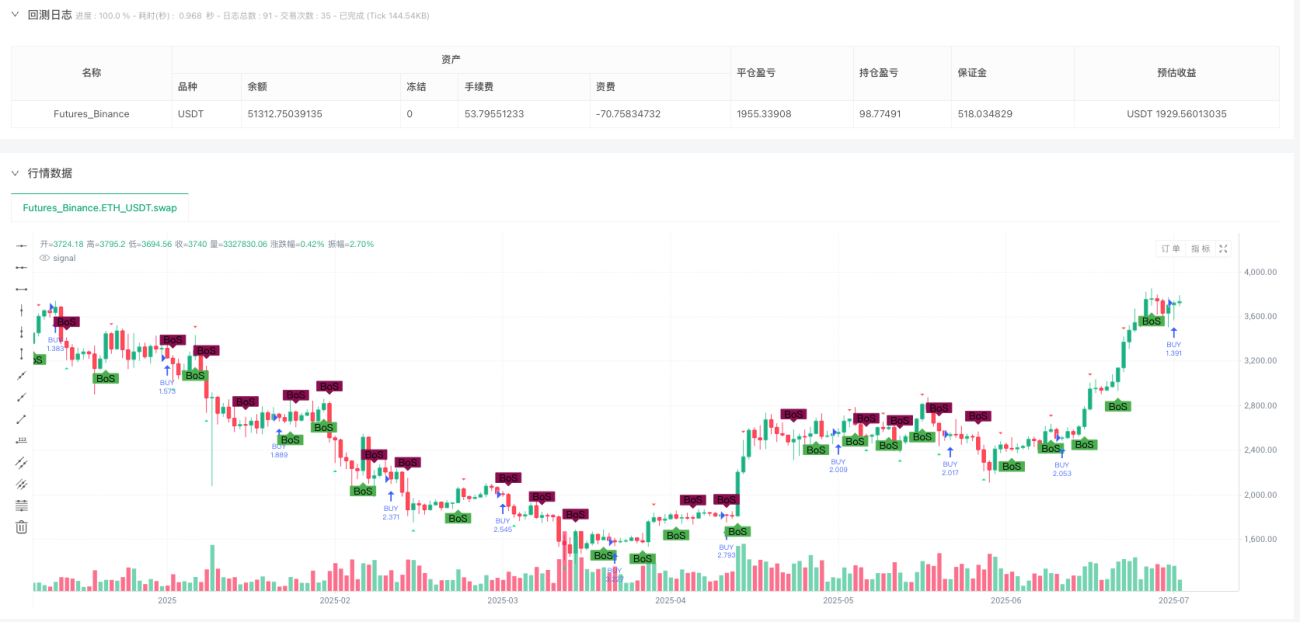
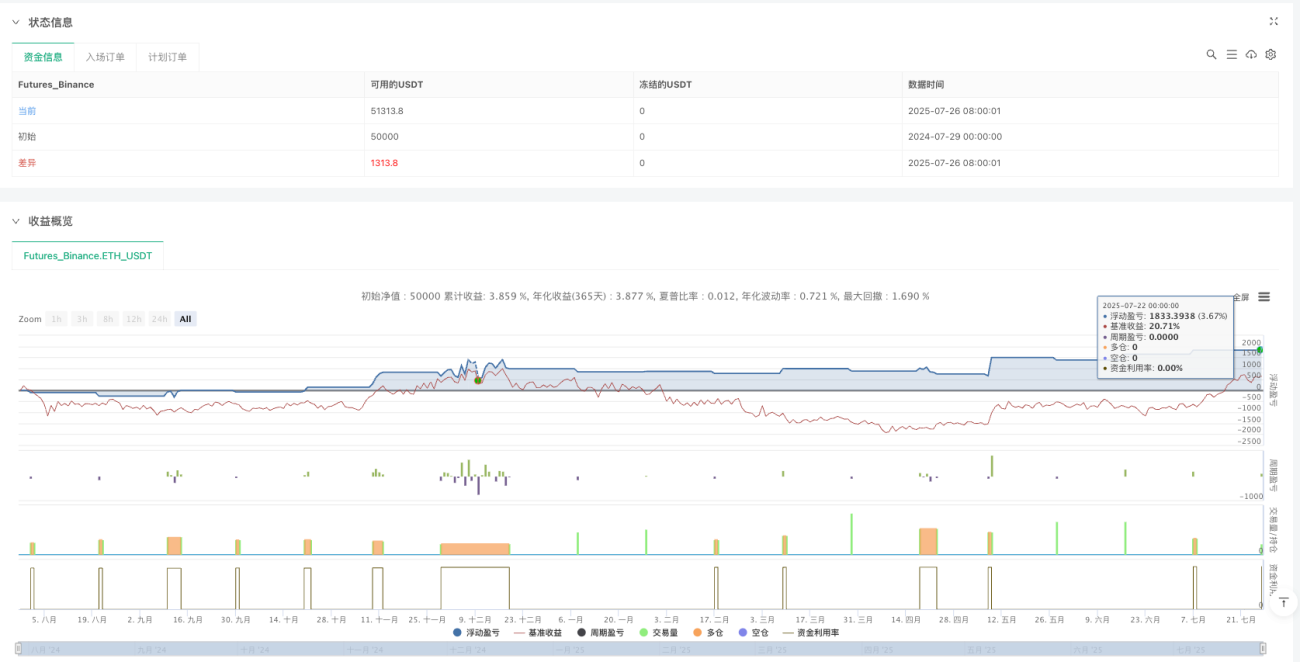
/*backtest
start: 2024-07-29 00:00:00
end: 2025-07-27 08:00:00
period: 1d
basePeriod: 1d
exchanges: [{"eid":"Futures_Binance","currency":"ETH_USDT"}]
*/

//@version=5
strategy("XAUUSD SMC Strategy (FVG + BoS)", overlay=true, default_qty_type=strategy.percent_of_equity, default_qty_value=10)

// === INPUTS ===- 1