Statistical Volatility Mean-Reversion Channel Trading Strategy with Dynamic Threshold Entry

Overview
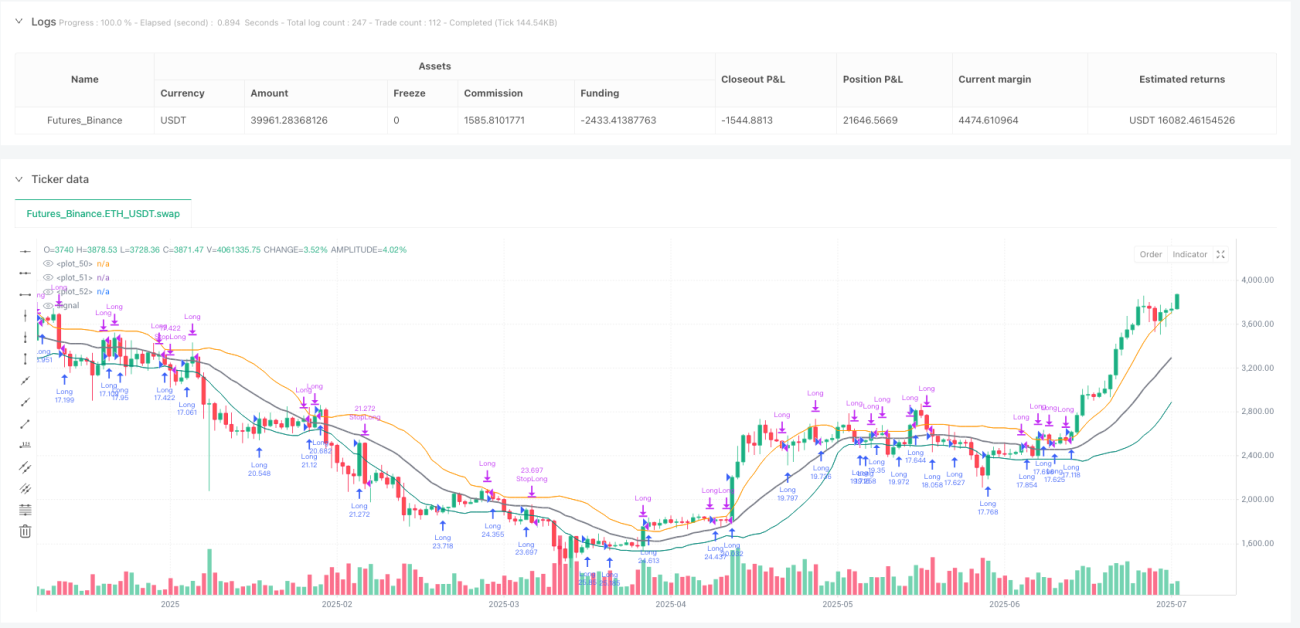
The Statistical Volatility Mean-Reversion Channel Trading Strategy with Dynamic Threshold Entry is a quantitative approach that leverages statistical properties of price volatility for short-term trading and scalping. Based on the statistical principle that prices fluctuate around their mean values, this strategy constructs price channels using standard deviation, enters long positions when prices touch the lower band and rebound, and exits when prices reach the middle or upper band. This strategy performs exceptionally well on 5-minute charts and is particularly suited for markets with high volatility but mean-reverting tendencies.
Strategy Principles
The core principle of this strategy is based on the concept of mean reversion in statistics, implemented through the following steps:
-
Calculate a 20-period Simple Moving Average (SMA) as the indicator of the central price tendency.
-
Calculate a 20-period Standard Deviation (STDEV) to quantify market volatility.
-
Construct a price channel:
- Upper band = SMA + STDEV
- Lower band = SMA - STDEV
- Middle line = (Upper + Lower) / 2
-
Entry logic: A long position is triggered when the price drops below the lower band and then rebounds above it. This is implemented using a boolean variable
wasBelowLowerthat tracks whether the price has previously broken below the lower band. -
Exit logic:
- Close the position when the price crosses above the middle line or touches the upper band
- Set a stop loss at a certain distance below the lower band (lower band - STDEV * 0.2), limiting maximum loss to approximately 2%
The strategy capitalizes on the statistical property that prices tend to revert to their mean after short-term deviations, buying at extreme deviation points (lower band) and selling during the reversion process (middle or upper band).
Strategy Advantages
-
Statistical Foundation: The strategy is built on solid statistical principles, using standard deviation as a measure of volatility to provide mathematical support for trading decisions.
-
Adaptability: The channel width automatically adjusts according to market volatility, remaining effective in different volatility environments.
-
Clear Entry and Exit Points: The strategy has clearly defined entry and exit conditions, reducing subjective judgment.
-
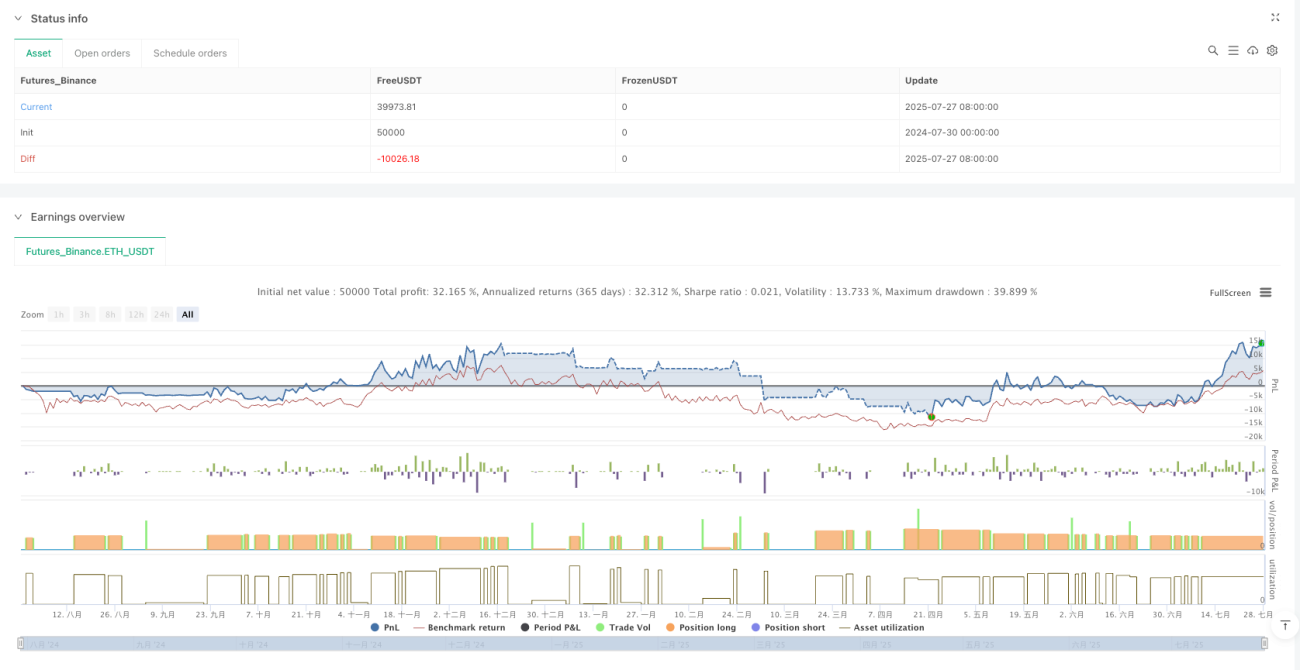
Risk Control: Built-in stop-loss mechanism limits the maximum loss percentage for each trade, effectively controlling risk.
-
Neutral Strategy: Although only long logic is implemented in the code, theoretically, the strategy can be extended to include short logic, becoming a complete bidirectional trading strategy.
-
Visual Feedback: The strategy plots the upper, lower, and middle bands on the chart, providing intuitive visual reference.
-
Simplicity and Efficiency: The strategy logic is straightforward, easy to understand and implement, with high computational efficiency.
Strategy Risks
-
Trending Market Risk: In strongly trending markets, prices may continue to move in one direction without reverting to the mean, leading to frequent false signals.
-
Event Risk: Sudden market events may cause price gaps, rendering stop-loss settings ineffective and resulting in losses beyond expectations.
-
Parameter Sensitivity: The 20-period SMA and STDEV parameter choices may not be suitable for all market conditions and require optimization for different markets.
-
False Breakout Risk: Prices may briefly break below the lower band before immediately falling back, triggering false entry signals.
-
Liquidity Risk: During periods of low liquidity, entry and exit executions may not be ideal, causing slippage.
-
One-Sided Strategy Limitation: The current strategy only implements long logic, potentially missing opportunities in consistently falling markets.
Solutions:
- Add trend filters to avoid counter-trend trading in strong trending markets
- Optimize parameters for different market conditions
- Add confirmation indicators to reduce false signals
- Implement short logic to make the strategy more comprehensive
Strategy Optimization Directions
-
Add Trend Filtering: Long-period moving averages or ADX indicators can be added to identify market trends, trading only in non-trending market environments suitable for mean reversion. This can significantly reduce losses from counter-trend trading.
-
Dynamic Stop-Loss Optimization: The current stop-loss is set at a fixed ratio (0.2 times the standard deviation). Consider dynamically adjusting the stop-loss distance based on market volatility, providing larger buffers in high-volatility markets and tightening stops in low-volatility markets.
-
Add Trade Confirmation Indicators: Combine RSI, stochastic, or other overbought/oversold indicators, requiring indicators to show oversold conditions when prices break below the lower band before triggering long positions, improving signal quality.
-
Implement Short Logic: Establish short positions when prices break above the upper band and then fall back, closing positions when prices touch the middle or lower band, making the strategy a complete bidirectional trading system.
-
Time Filter: Add trading time filters to avoid periods of poor liquidity or abnormal volatility, such as high volatility periods before and after daily market open and close.
-
Position Management Optimization: The current strategy uses a fixed 100% position size. Implement dynamic position management based on volatility or win rate to improve capital efficiency.
-
Multi-Timeframe Analysis: Incorporate trend information from higher timeframes, entering positions only when the higher timeframe trend aligns, increasing the success rate of trades.
These optimization directions can not only improve the strategy's stability and profitability but also reduce drawdowns, allowing the strategy to maintain good performance across different market environments.
Summary
The Statistical Volatility Mean-Reversion Channel Trading Strategy with Dynamic Threshold Entry is a short-term trading strategy based on statistical principles. It constructs price channels using standard deviation, enters long positions when prices touch the lower band and rebound, and takes profits when prices revert to the middle or upper band. The strategy's strengths lie in its strong adaptability, clear risk control, and distinct entry and exit signals, although it may face challenges in strongly trending markets.
By adding trend filters, optimizing stop-loss settings, adding trade confirmation indicators, and implementing bidirectional trading logic, the strategy's stability and adaptability can be further enhanced. Particularly, adding trend judgment and multi-timeframe analysis can significantly improve the strategy's performance across different market environments.
This strategy is suitable for short-term trading and swing operations, especially in markets with mean-reverting characteristics. By understanding its statistical foundation and optimization directions, traders can adjust according to their needs and market characteristics to build a more robust trading system.
- 1