200-Day SMA Dynamic Buffer Zone NASDAQ Leveraged Trading Strategy

Overview
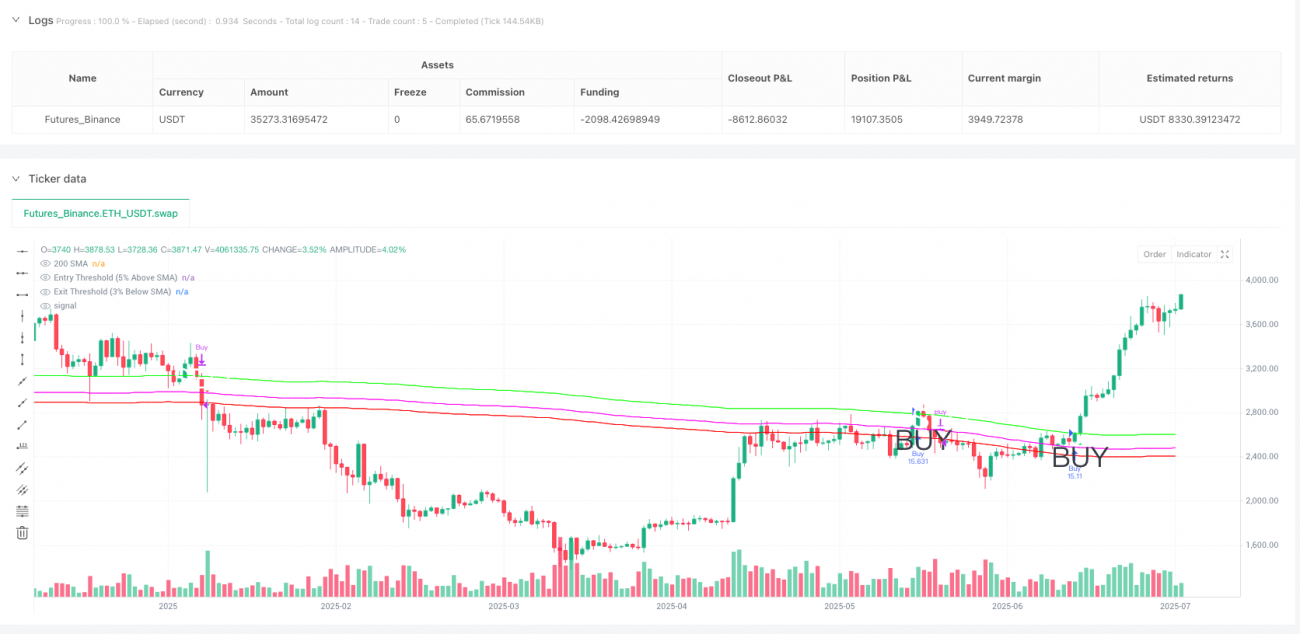
This strategy is a trading system based on the 200-day Simple Moving Average (SMA) combined with a dynamic buffer zone design, primarily used for leveraged ETF trading. The core concept involves adding asymmetric buy/sell buffer zones to the traditional 200-day moving average strategy: buying when price crosses 5% above the 200-day SMA and selling when it drops 3% below. The strategy is particularly suitable for leveraged ETFs like TQQQ, as it reduces false signals in sideways markets while maintaining trend-following capabilities, achieving a good balance between risk and return. During non-trading periods, funds can be parked in short-term treasury ETFs (such as SGOV), further optimizing capital efficiency.
Strategy Principles
The core principle of this strategy is an improvement on the traditional 200-day moving average breakout strategy through the implementation of asymmetric entry and exit buffer zones to reduce false signals. Specifically:
- Calculate the 200-day Simple Moving Average (SMA) as the baseline
- Set the upper buffer zone at SMA * (1 + 5%) as the buy threshold
- Set the lower buffer zone at SMA * (1 - 3%) as the sell threshold
- Generate a buy signal when the price crosses above the upper buffer zone
- Generate a sell signal when the price crosses below the lower buffer zone
The key to this design lies in the use of asymmetric buffer zones: buying requires stronger confirmation (5% buffer) while selling is more sensitive (3% buffer). This asymmetry helps maintain most of the uptrend gains while more quickly avoiding downside risks. Another important element of the strategy is applying it to QQQ or SPY price data, but executing actual trades on leveraged ETFs like TQQQ, amplifying returns while controlling risk through technical indicators.
In terms of code implementation, the strategy uses Pine Script language, defining SMA length, entry threshold, and exit threshold as adjustable parameters, increasing the strategy's flexibility. Additionally, the strategy tracks actual opening and closing operations, clearly marking buy and sell points on the chart for backtesting and real-time monitoring.
Strategy Advantages
Through in-depth analysis of the code and strategy description, this strategy has several significant advantages:
-
Simple and Clear Trading Signals: The strategy provides objective, emotion-free buy and sell signals that are not affected by market noise or external events, with trading decisions completely based on the relationship between price and moving averages.
-
Balance Between High Win Rate and Risk Control: According to testing, the strategy has a win rate of approximately 85%, with losing trades being smaller in magnitude compared to winning trades, effectively controlling single-trade risk.
-
Strong Adaptability: The strategy can fully capture upward trends in bull markets and exit promptly in bear markets while waiting for clear reversal signals, adapting to different market environments.
-
Tax Advantages: Due to the strategy's relatively low trading frequency and often longer holding periods, it can benefit from long-term capital gains tax advantages, saving 15-20% in taxes compared to frequent trading.
-
Energy Conservation: The strategy does not require continuous monitoring of the market or company fundamentals, with limited trading occurrences, making it suitable for investors who do not wish to operate frequently.
-
Balance Between Leveraged Returns and Risk: By executing on leveraged ETFs like TQQQ, it amplifies returns while controlling maximum drawdown risk within an acceptable range (approximately 53%) through technical indicators.
-
High Capital Utilization Efficiency: During non-trading periods, funds can be placed in short-term treasury ETFs to obtain risk-free returns, improving capital efficiency.
Strategy Risks
Despite its sophisticated design, the strategy still has the following risks:
-
Delay Risk: Using the 200-day moving average as a basic indicator has inherent lag, which may lead to suboptimal entry and exit points, especially when markets change direction rapidly.
-
Leverage Risk: Although the strategy itself controls risk through technical indicators, TQQQ as a 3x leveraged ETF still has the potential to amplify losses, particularly under extreme market conditions. The maximum drawdown of about 53% is still significant and requires investors to have sufficient risk tolerance.
-
Parameter Sensitivity: The 5% buy threshold and 3% sell threshold are fixed parameters that may not be suitable for all market environments. In different market conditions, optimal parameters may need adjustment.
-
Buffer Zone Trap: In oscillating markets with a clear direction, prices may fluctuate within the buffer zone without triggering trading signals, causing missed opportunities.
-
Backtest-Based Expectations: The 85% win rate and maximum drawdown data are based on historical backtest results. Future market environments may differ from history, and actual performance may vary.
Methods to address these risks include: appropriately adjusting buffer zone parameters to adapt to different market environments; using money management strategies, such as allocating only a portion of funds to this strategy; setting stop-losses to control single-trade risk; regularly evaluating strategy performance and making adjustments as needed.
Strategy Optimization Directions
Based on in-depth analysis of the strategy code, the following directions can further optimize strategy performance:
-
Adaptive Buffer Zones: The current strategy uses fixed 5% and 3% buffer zones, which could be improved to volatility-based adaptive buffer zones. For example, increasing buffer zone width in high-volatility environments and decreasing it in low-volatility environments would better adapt to different market conditions. ATR (Average True Range) or historical volatility indicators could be used to dynamically adjust buffer parameters.
-
Multi-Timeframe Confirmation: Introduce multi-timeframe analysis, such as considering both weekly and daily SMA signals, executing trades only when signals from multiple timeframes align, reducing false signals.
-
Add Trend Strength Filters: Introduce ADX or similar indicators to measure trend strength, trading only in strong trend environments to avoid frequent trading in sideways markets.
-
Partial Position Management: Modify the strategy to support partial position trading, such as building and reducing positions in batches based on signal strength or market conditions, rather than all-or-nothing operations, for better risk management.
-
Integrate Other Indicators for Confirmation: Combine RSI, MACD, or other indicators as auxiliary confirmation to enhance signal reliability. For example, execute SMA signals only when RSI indicates the market is not in overbought/oversold conditions.
-
Seasonal Adjustments: Consider market seasonality factors, adjusting strategy parameters or pausing trading during historically underperforming months.
-
Dynamic Asset Allocation: Dynamically adjust the asset allocation ratio between TQQQ and SGOV based on overall market conditions, rather than simple binary switching.
The core objective of these optimization directions is to improve the strategy's adaptability and robustness, reduce false signals and drawdowns, while maintaining or increasing overall returns. Implementing these optimizations requires thorough backtesting to ensure the improvements indeed enhance performance.
Summary
The 200-Day SMA Dynamic Buffer Zone Strategy is a quantitative trading system combining trend following and dynamic thresholds, particularly suitable for trading leveraged ETFs like TQQQ. Its core value lies in balancing trend following and false signal filtering through asymmetric buffer zone design, while applying it to leveraged products to amplify return potential. The strategy's simplicity, objectivity, and relatively high win rate make it a worthwhile investment tool, especially suitable for long-term investors and those wishing to reduce trading frequency.
Although the strategy has certain lag and parameter sensitivity risks, its performance and adaptability can be further enhanced through adaptive buffer zones, multi-timeframe confirmation, and dynamic asset allocation optimizations. Ultimately, this strategy represents a quantitative trading approach that organically combines technical analysis with risk management, providing investors with a simple yet effective framework for market participation.
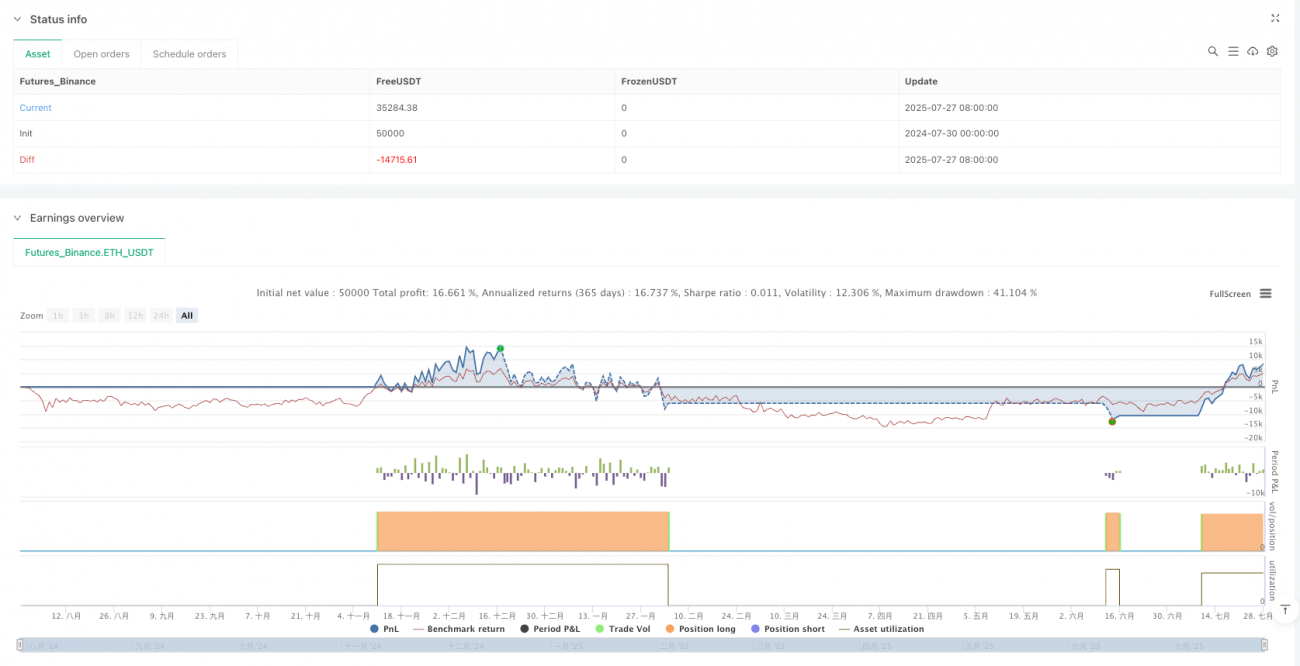
/*backtest
start: 2024-07-30 00:00:00
end: 2025-07-28 08:00:00
period: 1d
basePeriod: 1d
exchanges: [{"eid":"Futures_Binance","currency":"ETH_USDT"}]
*/

//@version=5
strategy("200 SMA +/- 5% Entry, -3% Exit Strategy (Since 2001)", overlay=true, default_qty_type=strategy.percent_of_equity, default_qty_value=100)

// === Inputs ===- 1