Overview
This is a quantitative trading strategy based on trend following principles, using multiple indicators to filter signals and improve trading accuracy. The strategy operates on a 5-minute timeframe, utilizing the 200 EMA and 21 EMA as primary trend filters, combined with RSI and MACD indicators for trade signal confirmation. The strategy employs fixed Stop Loss (15 pips) and Take Profit (22.5 pips) settings, creating a risk-reward ratio of 1:1.5, suitable for intraday trend following and low-risk entry trading.
Strategy Principles
The core of this strategy is using multiple technical indicators to establish a comprehensive trend confirmation system, filtering through multiple layers to avoid false breakouts and capture high-probability trend opportunities. The specific implementation principles are as follows:
Trend Direction Confirmation: Uses the 200-period Exponential Moving Average (EMA) as a long-term trend indicator and the 21-period EMA as a medium-term trend indicator. Price must be on the same side of both moving averages to consider entry.
Momentum Confirmation: Uses the Relative Strength Index (RSI) as an additional momentum filter. For long positions, RSI must be above 50; for short positions, RSI must be below 50, ensuring alignment with the overall trend direction.
Entry Trigger: Relies on MACD (12,26,9) indicator crossover signals as the final entry trigger condition. Long entry requires the MACD line to cross above the signal line with a positive MACD value; short entry requires the MACD line to cross below the signal line with a negative MACD value.
Risk Management: Each trade uses fixed Stop Loss (15 pips) and Take Profit (22.5 pips) settings, creating a 1:1.5 risk-reward ratio, which is a reasonable setting balancing risk and reward.
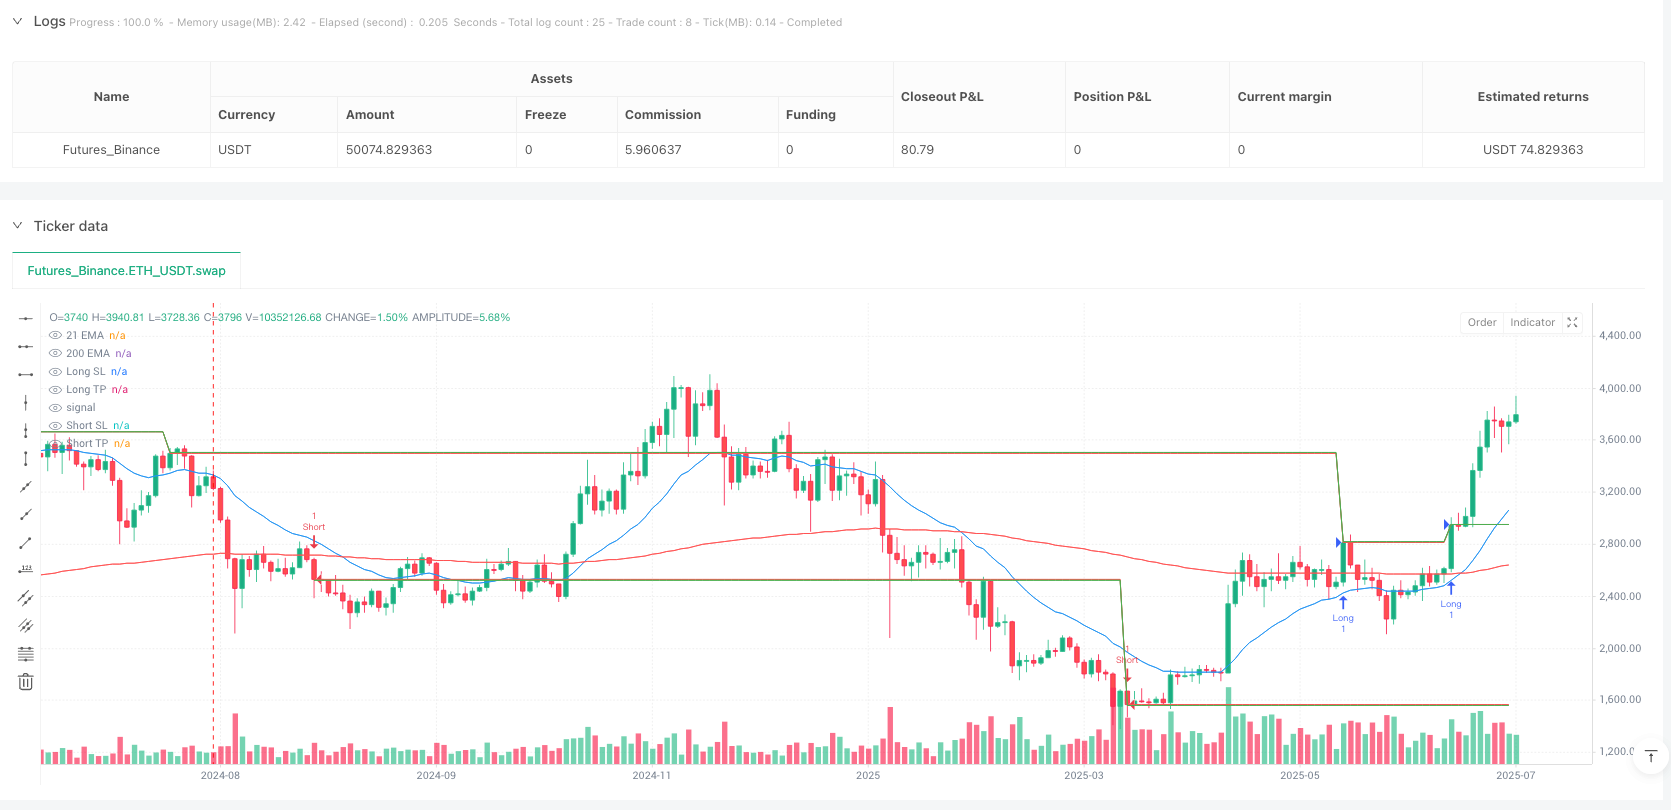
Visual Aids: The strategy includes visualization of trade labels and Stop Loss/Take Profit level lines, facilitating monitoring and backtest analysis.
Automated Notifications: Built-in alert conditions that can be set up for automated notifications through the platform, enabling semi-automated trading.
Strategy Advantages
Through in-depth analysis of the strategy’s code implementation, several significant advantages can be identified:
Multiple Filtering System: By combining three different types of indicators - moving averages, RSI, and MACD - the strategy establishes a strict signal filtering system that significantly reduces false signals and improves trading accuracy.
Clear Risk Control: Using fixed Stop Loss and Take Profit points, the risk of each trade is predetermined, facilitating fund management and risk control. The 1:1.5 risk-reward ratio setting is reasonable and aligns with professional trading principles.
Trend-Following Logic: The strategy design ensures trading only in the confirmed trend direction, avoiding the high risk of counter-trend operations.
Visual Feedback System: Through the visualization of labels and lines, traders can intuitively understand the strategy’s operational status and historical performance.
Flexible Fund Management: The strategy uses account equity percentage for position management, which can dynamically adjust with account size, suitable for long-term operation.
Easy to Automate: The built-in alert conditions make this strategy easy to integrate with automated trading systems, reducing emotional interference and human error.
Strategy Risks
Despite the reasonable design of this strategy, there are still some potential risks and limitations:
Fixed Stop Loss Risk: Using fixed pip values for stop losses may be insufficient in highly volatile markets, especially when market volatility suddenly increases, potentially causing stop losses to be easily triggered. An improvement would be to consider using ATR (Average True Range) to dynamically adjust stop loss levels.
Insufficient Trend Reversal Identification: The strategy performs well in strong trends but may react sluggishly at trend turning points, leading to entries in the original trend direction during the early stages of trend reversals. Consider adding trend strength indicators like ADX to avoid entries in weak trends.
Multiple Conditions May Over-Filter: While multiple conditions improve signal quality, they may also cause missed good trading opportunities. In practical application, it’s necessary to balance signal quality and frequency based on backtest results.
Optimized for 5-Minute Timeframe: The strategy is specifically designed for the 5-minute timeframe and may require parameter readjustment on other timeframes. Simple application to different timeframes without adjustment may lead to decreased performance.
Lack of Market State Adaptability: The strategy does not distinguish between ranging and trending markets, potentially producing frequent losing trades during consolidation phases. Consider adding volatility filters or market structure recognition logic.
Strategy Optimization Directions
Based on code analysis, this strategy has several possible optimization directions:
Dynamic Risk Management: Replace fixed pip Stop Loss and Take Profit with ATR-based dynamic stops and targets, allowing the strategy to automatically adjust risk parameters based on market volatility. The advantage of this approach is maintaining relatively consistent risk exposure in different volatility environments.
Add Trend Strength Filtering: Add ADX (Average Directional Index) as a trend strength indicator, only entering when trend strength is above a specific threshold (such as 25), avoiding trading in weak trends or oscillating markets.
Optimize Entry Timing: Consider waiting for price to pull back to near the moving average after confirmation signal before entering, to get better entry prices and smaller stop loss distances, improving the risk-reward ratio.
Add Trading Session Filters: Analyze performance during different trading sessions, potentially finding that certain specific sessions (such as the European-American session overlap) perform better, and only activating the strategy during these sessions.
Implement Partial Profit Locking Mechanism: When a trade reaches a certain profit level (such as 50% of the target), move the stop loss to entry price or profit point, ensuring at least partial profit is secured.
Add Market State Judgment: Use Bollinger Band width or similar indicators to determine market state (trending or ranging), using different trading logic or parameter settings in different states.
Parameter Optimization and Backtesting: Optimize and backtest moving average periods, RSI thresholds, MACD parameters, etc., to find the parameter combinations with the best historical performance, but be careful to avoid overfitting.
Summary
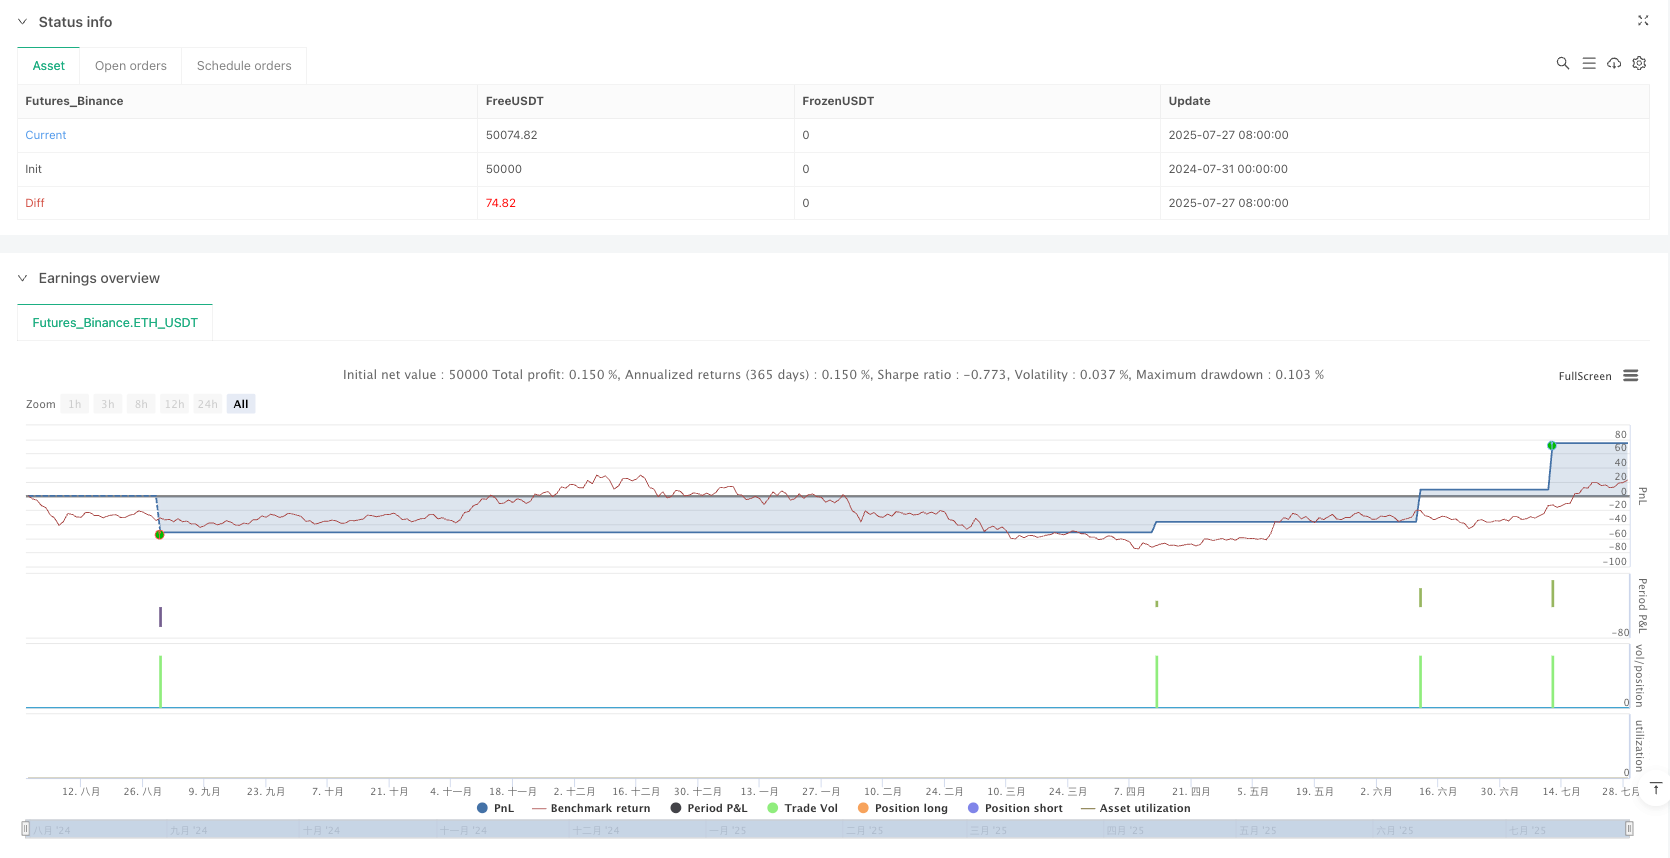
This is a well-designed trend following strategy that establishes a strict signal filtering system through the comprehensive application of multiple technical indicators, improving the quality of trading signals. The fixed risk management settings provide a stable risk control framework for the strategy, suitable for intraday traders and trend followers.
While the strategy may perform well in strong trending environments, it may face challenges during market state transitions and high volatility environments. By implementing the suggested optimization measures, especially enhancing dynamic risk management and market state adaptability, the robustness and adaptability of the strategy can be further improved.
The strategy overall reflects the core principles of systematic trading: strict entry conditions, clear exit rules, and consistent risk management, very suitable for traders who wish to reduce emotional interference and strictly execute a trading system.
/*backtest
start: 2024-07-31 00:00:00
end: 2025-07-29 08:00:00
period: 2d
basePeriod: 2d
exchanges: [{"eid":"Futures_Binance","currency":"ETH_USDT"}]
*/

//@version=5
strategy("TPC Strategy XAUUSD - M5 with Fixed SL/TP", overlay=true)

// === INPUTS ===
ema200 = ta.ema(close, 200)
ema21 = ta.ema(close, 21)
rsi = ta.rsi(close, 14)
[macdLine, signalLine, _] = ta.macd(close, 12, 26, 9)

// === CONDITIONS ===
longCondition = close > ema200 and close > ema21 and rsi > 50 and macdLine > signalLine and ta.crossover(macdLine, signalLine)
shortCondition = close < ema200 and close < ema21 and rsi < 50 and macdLine < signalLine and ta.crossunder(macdLine, signalLine)

// === TRADE PARAMETERS ===
sl_pips = 15.0
tp_pips = 22.5
sl = sl_pips * syminfo.mintick * 10
tp = tp_pips * syminfo.mintick * 10

// === TRADE ENTRIES ===
var float long_entry_price = na
var float short_entry_price = na

if (longCondition)
    strategy.entry("Long", strategy.long)
    long_entry_price := close
    label.new(bar_index, low, "BUY", style=label.style_label_up, color=color.green, textcolor=color.white, size=size.small)

if (shortCondition)
    strategy.entry("Short", strategy.short)
    short_entry_price := close
    label.new(bar_index, high, "SELL", style=label.style_label_down, color=color.red, textcolor=color.white, size=size.small)

// === STRATEGY EXITS ===
strategy.exit("Long TP/SL", from_entry="Long", stop=close - sl, limit=close + tp)
strategy.exit("Short TP/SL", from_entry="Short", stop=close + sl, limit=close - tp)

// === PLOTS ===
plot(ema200, color=color.red, title="200 EMA")
plot(ema21, color=color.blue, title="21 EMA")

// === PLOT SL & TP LINES ===
plot(long_entry_price ? long_entry_price - sl : na, title="Long SL", color=color.red, style=plot.style_linebr, linewidth=1)
plot(long_entry_price ? long_entry_price + tp : na, title="Long TP", color=color.green, style=plot.style_linebr, linewidth=1)

plot(short_entry_price ? short_entry_price + sl : na, title="Short SL", color=color.red, style=plot.style_linebr, linewidth=1)
plot(short_entry_price ? short_entry_price - tp : na, title="Short TP", color=color.green, style=plot.style_linebr, linewidth=1)

// === ALERT CONDITIONS ===
alertcondition(longCondition, title="Buy Signal", message="📈 XAUUSD Buy Setup (M5) detected!")
alertcondition(shortCondition, title="Sell Signal", message="📉 XAUUSD Sell Setup (M5) detected!")