
Overview
The Dual EMA Crossover Momentum Validation Trading Strategy is a high-precision trading system designed for intraday swing trading. This strategy identifies high-probability entry and exit signals through a confluence of technical indicators and real-time volume dynamics analysis. The core mechanism is based on the crossover between short-term and long-term Exponential Moving Averages (EMA), combined with Relative Strength Index (RSI), Moving Average Convergence Divergence (MACD), and candlestick pattern filtering to achieve multi-dimensional trade signal confirmation. This comprehensive approach aims to capture short-term price trend changes while filtering out low-quality signals to improve trading success rates.
Strategy Principles
The core principle of this strategy is to identify strong trend signals through the collaborative validation of multiple technical indicators:
-
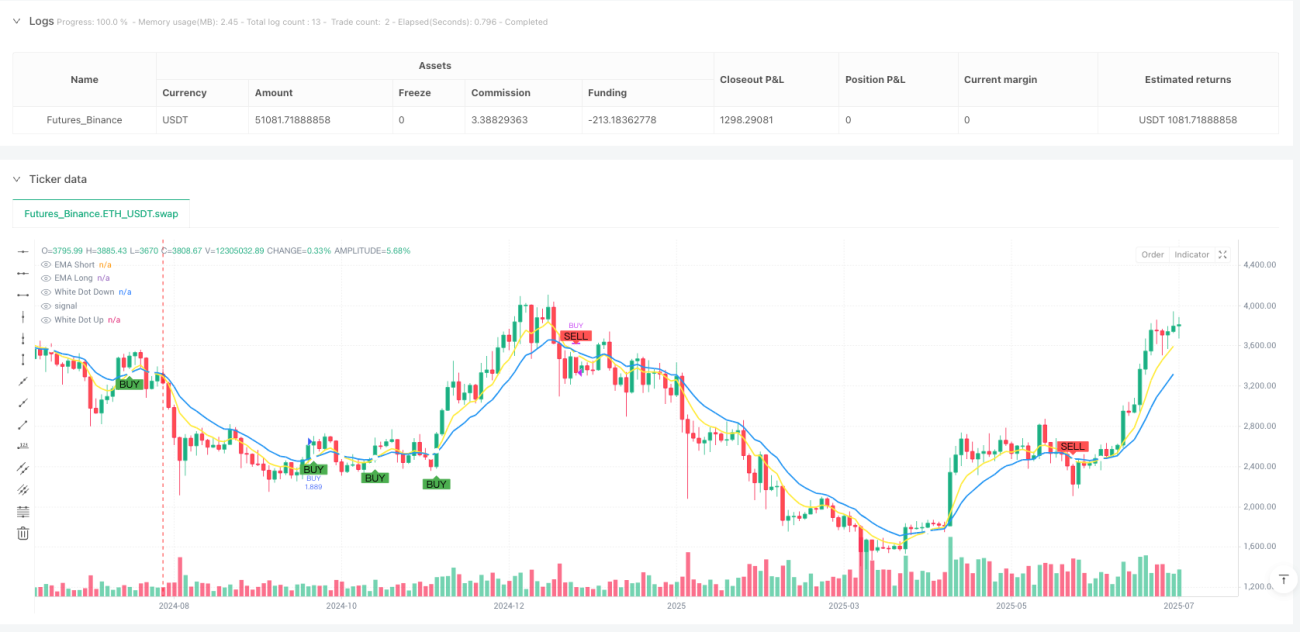
Dual EMA Crossover System: Uses 7-period and 14-period EMAs to determine short-term trend direction. When the short-term EMA(7) crosses above the long-term EMA(14), it generates a potential buy signal; when the short-term EMA crosses below the long-term EMA, it generates a potential sell signal.
-
RSI Momentum Filter: Uses the 14-period RSI indicator as a momentum confirmation tool. The strategy requires the RSI value to be greater than 50 for buy signals, indicating that the market has upward momentum; for sell signals, the RSI value needs to be less than 50, indicating that momentum has turned downward.
-
MACD Trend Validation: Further validates trend direction and strength through the MACD indicator (parameters 12,26,9). The buy condition requires the MACD histogram to be positive, confirming an uptrend; the sell condition requires the MACD histogram to be negative, confirming a downtrend.
-
Candlestick Pattern Confirmation: Incorporates price action into the decision-making process, requiring the current candle to be bullish (closing price higher than opening price) for buy signals; for sell signals, the current candle must be bearish (closing price lower than opening price).
-
Signal Visualization: The strategy uses white dots to mark EMA crossover points on the chart and colored labels to mark buy and sell signals, improving the visibility of trading signals.
-
Automated Alert System: The strategy generates JSON-formatted alerts containing trading instrument, price, RSI value, and volume data, facilitating integration with Google Sheets, Power BI, and trading platforms.
Strategy Advantages
-
Multiple Confirmation Mechanisms: By combining EMA crossovers, RSI momentum, MACD trends, and candlestick patterns, a multi-layered filtering system is formed that effectively reduces false signals and improves trading quality.
-
Strong Adaptability: Strategy parameters can be adjusted to suit different market environments and volatility conditions. The basic parameter settings have been optimized for intraday swing trading.
-
Clear Visual Feedback: By intuitively marking trading signals and key technical levels on the chart, traders can quickly assess potential trading opportunities and risks.
-
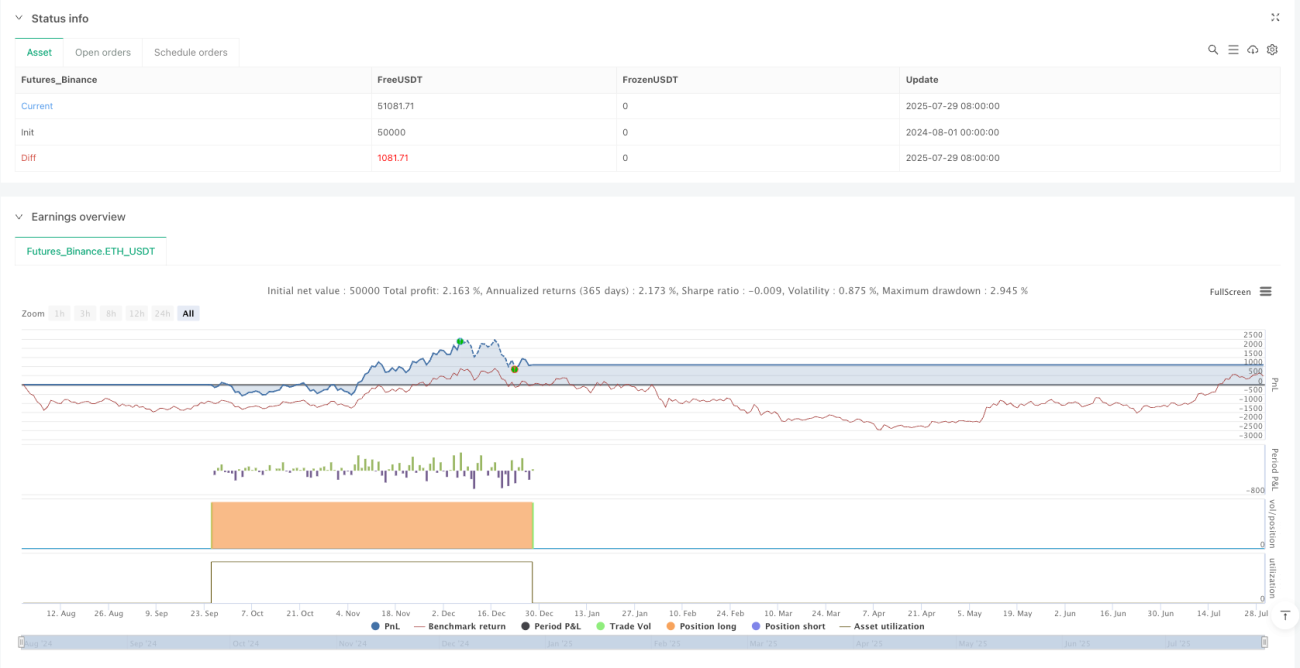
Integrated Risk Management: The strategy defaults to using a percentage of account equity (10%) for position management, providing a foundation for risk control.
-
Automation-Friendly: Through structured JSON alert output, the strategy supports seamless integration with external systems, enabling automated trading and performance tracking.
-
Comprehensive Trade Information Capture: Each trading signal includes key market data (price, RSI, volume), facilitating subsequent analysis and strategy optimization.
Strategy Risks
-
EMA Lag: Although EMAs respond faster than simple moving averages, they still have inherent lag, which may cause missed turning points in rapidly changing markets. The solution is to consider shortening EMA periods or incorporating more sensitive indicators such as price momentum.
-
Oscillating Market Risk: In sideways or low-volatility markets, EMA crossovers may generate frequent false signals. The solution is to add volatility filters or trend strength confirmation to avoid trading in low-volatility environments.
-
Multiple Conditions Limiting Trading Frequency: Strict multiple conditions may cause missed profitable opportunities. The solution is to dynamically adjust condition strictness based on market conditions or create a tiered signal system (strong signals, moderate signals, etc.).
-
Fixed Parameter Adaptability Issues: Preset indicator parameters may not be suitable for all market conditions. The solution is to implement an adaptive parameter system or create parameter profiles for different market environments.
-
Fixed Nature of RSI Threshold: Using a fixed threshold of 50 may not be suitable for all market environments. The solution is to consider using dynamic RSI thresholds that automatically adjust based on historical market behavior.
Strategy Optimization Directions
-
Adaptive Parameter Adjustment: Implement dynamic adjustment of EMA, RSI, and MACD parameters, automatically optimizing parameters based on market volatility and trading session characteristics. This will improve the strategy's adaptability and performance under different market conditions.
-
Volume Analysis Enhancement: The current strategy collects volume data but doesn't fully utilize it. Volume anomaly detection and volume-weighted signal systems can be added to enhance trading signal quality. Volume spikes often indicate accelerated price movements and can serve as powerful tools for signal confirmation.
-
Stop-Loss and Take-Profit Logic: Add dynamic stop-loss and take-profit settings based on ATR (Average True Range) or key support/resistance levels to perfect the risk management framework. This will transform the strategy from a pure signal generation tool to a complete trading system.
-
Multi-Timeframe Analysis: Integrate higher timeframe trend confirmation to ensure intraday trading aligns with larger trend directions. This can reduce counter-trend trading and improve overall success rates.
-
Machine Learning Optimization: Introduce machine learning models to optimize the weighting of multi-indicator signals and identify the best indicator combinations and parameter settings. Through training on historical data, the predictive accuracy of the strategy can be significantly enhanced.
-
Market State Classification: Implement an automatic classification system for market states (trending, oscillating, breakout, etc.), adopting different trading rules and parameter settings for different market states. This will greatly improve the strategy's environmental adaptability.
Summary
The Dual EMA Crossover Momentum Validation Trading Strategy is a well-structured intraday trading system that provides traders with high-quality entry and exit signals through a combination of EMA crossovers, momentum confirmation, trend validation, and candlestick pattern analysis. Its main advantages lie in its multiple confirmation mechanisms and signal visualization, effectively reducing the risk of false signals. At the same time, the strategy's automation-friendly characteristics make it easy to integrate with external systems to achieve trading process automation.
Although the strategy has inherent limitations such as EMA lag and parameter fixity, these issues can be effectively mitigated through the suggested optimization directions, such as adaptive parameter adjustment, volume analysis enhancement, and multi-timeframe integration. In particular, the introduction of machine learning optimization and market state classification systems will significantly enhance the strategy's adaptability and overall performance.
As a technical indicator-driven trading system, this strategy provides traders with a solid foundation framework that can be further customized and expanded based on individual risk preferences and market experience. Through continuous backtesting and optimization, this strategy has the potential to become a powerful tool in a trader's arsenal.
/*backtest
start: 2024-08-01 00:00:00
end: 2025-07-30 08:00:00
period: 2d
basePeriod: 2d
exchanges: [{"eid":"Futures_Binance","currency":"ETH_USDT"}]
*/

//@version=6
strategy("Intra Bullish Strategy - Profit Ping v4.0", overlay=true, default_qty_type=strategy.percent_of_equity, default_qty_value=10)

// === INPUTS ===- 1