
Strategy Overview
The KDJ Extreme Reversal Trend Following Strategy is a quantitative trading system that combines momentum reversal and trend following concepts. The core of this strategy lies in capturing the first reversal signal after the J indicator reaches extreme values (0 or 100), while using the EMA676 line for trend direction filtering to ensure that the trading direction aligns with the main trend. The system employs precise entry conditions, flexible position management, and strict risk control mechanisms to find high-probability trading opportunities in volatile markets. The strategy is particularly suitable for tracking rebounds after technical indicators show overbought or oversold conditions, by monitoring the pattern of J value changes over 3 consecutive candles to confirm potential trend turning points, thereby establishing positions at the early stages of price reversals to capture significant price movements.
Strategy Principles
The core logic of this strategy is built on the characteristics of the J value in the KDJ indicator, combined with trend filtering for precise entry. The specific principles are as follows:
-
J Value Extreme Identification: The strategy monitors whether the J value reaches the preset extreme range (default upper limit 100, lower limit 0), which typically represents market conditions of excessive buying or selling.
-
Continuous Change Pattern Confirmation: The strategy requires that after the J value reaches an extreme, there must be a unidirectional change over 3 consecutive candles (continuous rise or continuous fall), which confirms the strong movement of the indicator.
-
Reversal Signal Capture: After the J value completes a unidirectional movement over 3 consecutive candles, the strategy detects the first opposite direction change, i.e., the turning point where the J value shifts from a continuous rise to a fall, or from a continuous fall to a rise.
-
Trend Direction Filtering: The strategy uses the EMA676 line as a trend judgment standard, only considering long signals when the price is above the line, and short signals when the price is below the line, ensuring that the trading direction is consistent with the overall trend.
-
Dynamic Take-Profit and Stop-Loss: The strategy calculates take-profit and stop-loss levels based on a percentage of the entry price, with default settings of 3% for take-profit and 2.2% for stop-loss, achieving a risk-reward ratio greater than 1.
-
Intelligent Position Management: The system provides two position calculation methods - fixed contract quantity and risk percentage-based. The latter dynamically adjusts position size based on the risk exposure of each trade, optimizing the efficiency of capital utilization.
Strategy Advantages
After in-depth analysis of the code, this strategy demonstrates the following significant advantages:
-
Precise Signal Triggering Mechanism: By requiring the J value not only to reach extremes but also to undergo unidirectional movement over 3 consecutive candles before capturing the first reversal, this compound condition greatly improves the reliability of the signals and reduces false breakouts.
-
Perfect Combination of Trend and Reversal: The strategy cleverly integrates trend following (EMA676 direction filtering) and reversal trading (J value extreme rebound), both respecting the major trend direction and capturing high-probability rebound opportunities within the trend.
-
Adaptive Risk Management: The code implements dynamic position calculation based on risk percentage, keeping the risk exposure of each trade consistent regardless of market volatility changes, maintaining stable risk control.
-
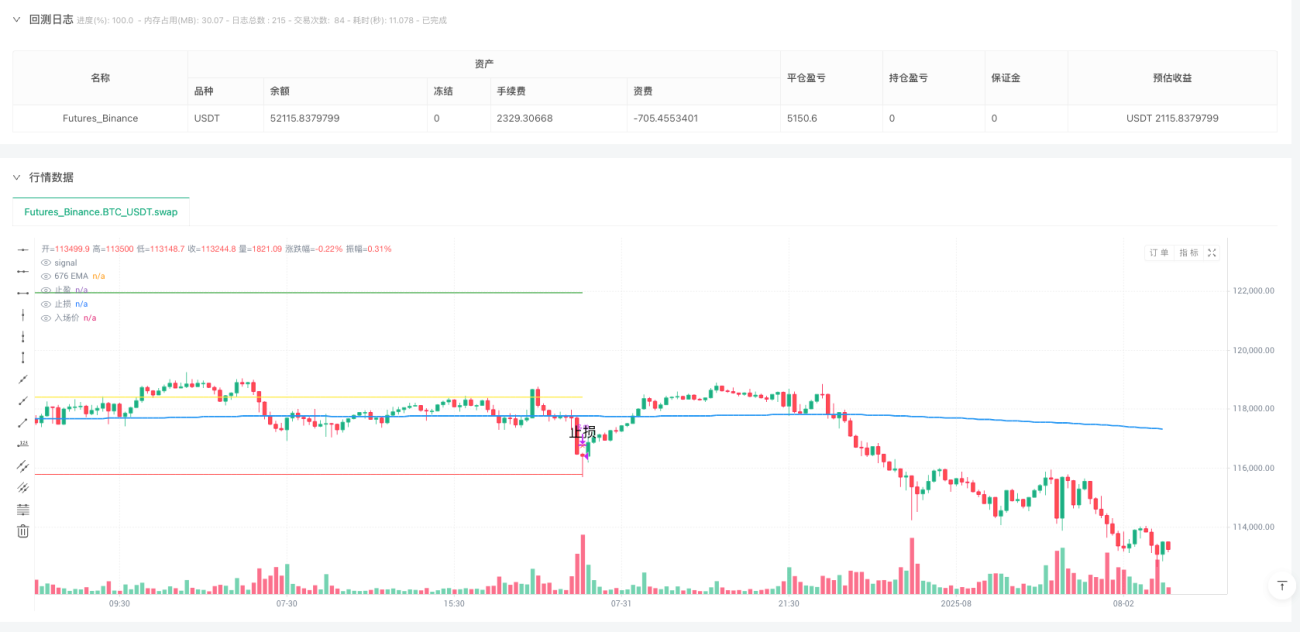
Clear Visual Feedback: The strategy plots entry signals, take-profit and stop-loss trigger points, and key price lines on the chart, allowing traders to intuitively understand the execution logic and results of each trade.
-
Flexible Parameter Configuration: The system provides a rich set of adjustable parameters, including KDJ calculation periods, EMA length, extreme value settings, take-profit and stop-loss ratios, allowing the strategy to adapt to different market environments and trading instruments.
-
Early Warning Mechanism: The code designs early warning conditions for approaching signal triggers, such as when the J value approaches the extreme zone or is about to form an entry signal, which can notify traders in advance to prepare, improving operational efficiency.
Strategy Risks
Despite the sophisticated design of this strategy, there are still the following potential risks:
-
Stop-Loss Failure in Extreme Market Conditions: During market gaps or extreme volatility, the preset percentage stop-loss may not execute at the expected price, resulting in actual losses exceeding expectations. The solution is to introduce off-market stop-loss mechanisms or consider using on-market conditional orders as a backup.
-
Moving Average Lag Risk: As a long-period moving average, EMA676 has significant lag, which may provide incorrect directional guidance during the initial stages of trend reversals. It is recommended to combine multi-period analysis or add short-term trend confirmation indicators to optimize signal quality.
-
Parameter Optimization Overfitting: Current parameters (such as KDJ period 60, extreme settings 100/0) may be derived from historical data optimization, posing a risk of overfitting. It is recommended to verify parameter robustness through forward testing and testing across different periods.
-
J Value Calculation Deviation: The strategy uses a custom bcwsma function to calculate KDJ values, which may differ from standard KDJ calculations on different platforms, leading to inconsistencies between backtesting and live trading signals. Consistency in calculation methods should be confirmed before live trading.
-
Low Liquidity Market Risk: In markets with lower trading volume, the slippage for take-profit and stop-loss may be larger, affecting the actual performance of the strategy. It is recommended to apply this strategy in high-liquidity markets or mainstream trading instruments.
-
Unstable Signal Frequency: Signals based on extreme reversals may vary significantly in frequency across different market environments, leading to unstable capital utilization efficiency. Consider adding auxiliary trading signals or multi-timeframe confirmation mechanisms to smooth trading frequency.
Strategy Optimization Directions
Based on the current characteristics of the strategy, the following optimization directions can be considered:
-
Dynamic Extreme Value Settings: The current strategy uses fixed extreme upper and lower limits (100 and 0). Consider dynamically adjusting the extreme range based on historical volatility to adapt to different volatility environments, such as narrowing the extreme range during low volatility periods and expanding it during high volatility periods.
-
Multi-Timeframe Confirmation: Introduce higher timeframe signal confirmation, for example, requiring the J value on the daily timeframe to also be in the extreme zone, or confirming consistency between 3-minute and 15-minute timeframe signals to improve signal quality.
-
Intelligent Take-Profit Mechanism: Implement dynamic take-profit strategies, such as partial position closing or ATR (Average True Range) based take-profit level calculation, or using trailing stops after profits reach a certain level to maximize trend profit capture.
-
Market Environment Filtering: Add volatility filtering conditions to pause trading or adjust position sizes in excessively volatile or extremely low volatility market environments, avoiding trading in market environments that are not suitable for the strategy's characteristics.
-
Signal Strength Grading: Based on factors such as J value reversal amplitude, candlestick patterns, and volume confirmation, grade signal strength and dynamically adjust position size according to signal strength, increasing positions for strong signals and decreasing for weak ones.
-
Machine Learning Optimization: Introduce machine learning algorithms to automatically optimize parameter combinations, or extract features from historical signals to build prediction models to evaluate the success probability of each signal, improving the adaptability and robustness of the strategy.
Conclusion
The KDJ Extreme Reversal Trend Following Strategy is a well-structured, logically clear quantitative trading system that captures technical indicator extreme reversals combined with trend direction filtering, maintaining a high win rate while controlling risk. The core advantages of the strategy lie in the precision of its signal triggering mechanism and the completeness of its risk management, making it suitable for market environments with clear medium to long-term trends but with volatility.
From an implementation perspective, the strategy code has a clear structure, rigorous calculation logic, and includes complete trading management functions, with detailed implementation from signal generation, position calculation to take-profit and stop-loss execution. Through the optimization directions proposed in this article, especially dynamic parameter adjustment and multi-dimensional signal confirmation, the stability and adaptability of the strategy can be further enhanced.
For traders, when applying this strategy, attention should be paid to verifying the applicability of parameters under different market conditions and adjusting take-profit, stop-loss, and position settings according to personal risk preferences. At the same time, it is recommended to combine fundamental analysis and technical analysis from higher timeframes to improve the comprehensiveness and accuracy of trading decisions.
//@version=6
strategy("J值极值趋势跟随策略", overlay = true,
         default_qty_type = strategy.percent_of_equity, default_qty_value = 10,  // 降低每笔交易的仓位大小
         initial_capital = 10000,
         margin_long = 20, margin_short = 20)  // 设置合理的保证金要求

// === 策略说明:J值极值趋势跟随策略 ===
// 主图:显示J值连续下降后反弹的买点和连续上升后回调的卖点
// 副图:显示J线走势、中轴线、极值区域
// 方向过滤:676均线,价格在上方只做多,下方只做空
// 止盈止损:基于百分比波动,默认1%止盈1%止损
- 1