
Overview
The UT Bot Dynamic Trend Following with RSI Composite Strategy is a quantitative trading approach that combines an adaptive trend following system with the Relative Strength Index (RSI). The core mechanism uses Average True Range (ATR) to construct dynamic support and resistance bands, coupled with RSI overbought and oversold signals to capture market turning points, while integrating the 200-period Exponential Moving Average (EMA200) for trend confirmation. The strategy also features an ATR-based dynamic take-profit and stop-loss mechanism that automatically adjusts risk management parameters according to market volatility.
Strategy Principles
This strategy's core principles are based on two main technical indicator systems: the UT Bot trend following system and the RSI oscillator.
The UT Bot trend following system calculates price volatility ranges using the ATR indicator to construct dynamic channels:
- Upper Band (upperBand) = Current Price + factor * ATR
- Lower Band (lowerBand) = Current Price - factor * ATR
The system maintains a tracking line (trail) to determine the current trend direction:
- When price crosses above the tracking line, the trend is up (dir = 1)
- When price crosses below the tracking line, the trend is down (dir = -1)
- Trend change signals are captured by direction changes in the dir variable
Simultaneously, the strategy incorporates RSI indicator filtering:
- When RSI < 40 (oversold zone) and the trend shifts from down to up, a buy signal is generated
- When RSI > 60 (overbought zone) and the trend shifts from up to down, a sell signal is generated
Additionally, the strategy integrates EMA200 as a long-term trend reference line and establishes percentage-based take-profit and stop-loss mechanisms:
- Take profit is set at 3% of the entry price
- Stop loss is set at 1.5% of the entry price
Strategy Advantages
-
Strong Dynamic Adaptability: By automatically adjusting trading bandwidth through the ATR indicator, the strategy can adapt to different market volatility environments, performing effectively in both high and low volatility markets.
-
Trend and Oscillation Integration: The strategy fuses trend following and oscillator trading approaches, following trends when they are clear and seeking reversal opportunities during market overbought or oversold conditions, enhancing the strategy's comprehensiveness.
-
Precise Entry Points: The widened RSI (60/40) overbought and oversold levels increase trading signal frequency while maintaining signal quality, optimizing entry timing.
-
Comprehensive Risk Management: The integrated dynamic take-profit and stop-loss mechanism, with a take-profit ratio (3%) greater than the stop-loss ratio (1.5%), adheres to positive expectancy trading principles, conducive to long-term stable profitability.
-
Immediate Signal Alerts: The strategy features buy and sell signal alerts, allowing traders to seize market opportunities promptly.
-
Clear Modular Structure: The code structure is clear with distinct functional modules, facilitating subsequent maintenance and optimization.
Strategy Risks
-
False Signals in Ranging Markets: In markets without clear trends, the strategy may generate frequent crossover signals, leading to consecutive losses. The solution is to add trend strength filtering conditions, such as ADX indicator or trend duration requirements.
-
Stop Loss Too Small Risk: The current 1.5% stop loss may be too small in certain high-volatility markets, easily triggered by market noise. It is recommended to dynamically adjust the stop loss ratio based on the characteristics of the trading instrument and timeframe.
-
Parameter Sensitivity: Strategy performance is sensitive to parameters such as RSI length, overbought/oversold levels, and ATR factor, with different parameter combinations performing differently in various market environments. Comprehensive parameter optimization and backtesting are recommended.
-
Lack of Market State Identification: The strategy does not explicitly distinguish between different market states (trending, oscillating, consolidating), potentially underperforming in certain market environments.
-
Insufficient EMA200 Reference: Although the EMA200 line is plotted, the strategy does not incorporate it as a trading condition, not fully utilizing long-term trend information.
Strategy Optimization Directions
-
Add Trend Strength Filtering: Introduce ADX indicator or other trend strength indicators to ensure trading only occurs during clear trends, avoiding false signals in ranging markets. Optimized conditions could be:
trendStrength = ta.adx(14) > 25 buyCondition = trendStrength and trendUp and rsi < rsiUnder -
Improve Dynamic Stop Loss Mechanism: Replace fixed percentage stop loss with ATR-based dynamic stop loss to adapt to different market volatilities:
stopLoss = atr * slFactor strategy.exit("TP/SL", from_entry="Buy", profit=tpPercent, loss=stopLoss/close*100) -
Add Volume Confirmation: Significant trend changes are often accompanied by notable volume changes; adding volume confirmation can improve signal quality:
volumeConfirmation = volume > ta.sma(volume, 20) * 1.5 buy = trendUp and rsi < rsiUnder and volumeConfirmation -
Market State Classification Trading: Classify market states based on volatility and trend indicators, employing different trading strategies and parameters for different market states:
isVolatile = atr/close*100 > historical average level isTrending = ta.adx(14) > 25 -
Add Time Filtering: Avoid trading during important economic data releases or periods of insufficient market liquidity to reduce unexpected risks:
            validTradingHour = (hour >= 9 and hour <= 16)
buy = validTradingHour and trendUp and rsi < rsiUnder
Summary
The UT Bot Dynamic Trend Following with RSI Composite Strategy is a comprehensive trading system combining dynamic volatility channels and oscillator indicators. It captures trend changes through UT Bot's adaptive channels, confirms entry signals using RSI overbought and oversold levels, and integrates percentage-based risk management mechanisms. The strategy's greatest strengths lie in its dynamic adaptability and ability to utilize multiple technical indicators, enabling it to find trading opportunities in various market environments.
However, the strategy may generate false signals in ranging markets and is sensitive to parameter settings. Future optimization directions should focus on adding trend strength filtering, improving dynamic risk management, introducing volume confirmation, and implementing market state classification trading. Through these optimizations, the strategy has the potential to further enhance stability and adaptability while maintaining its original advantages, evolving into a more comprehensive and robust quantitative trading system.
Overall, this is a well-designed, logically clear quantitative strategy suitable for traders with a certain foundation in technical analysis. With appropriate parameter adjustments and implementation of optimization directions, the strategy has the potential to achieve stable returns in actual trading.
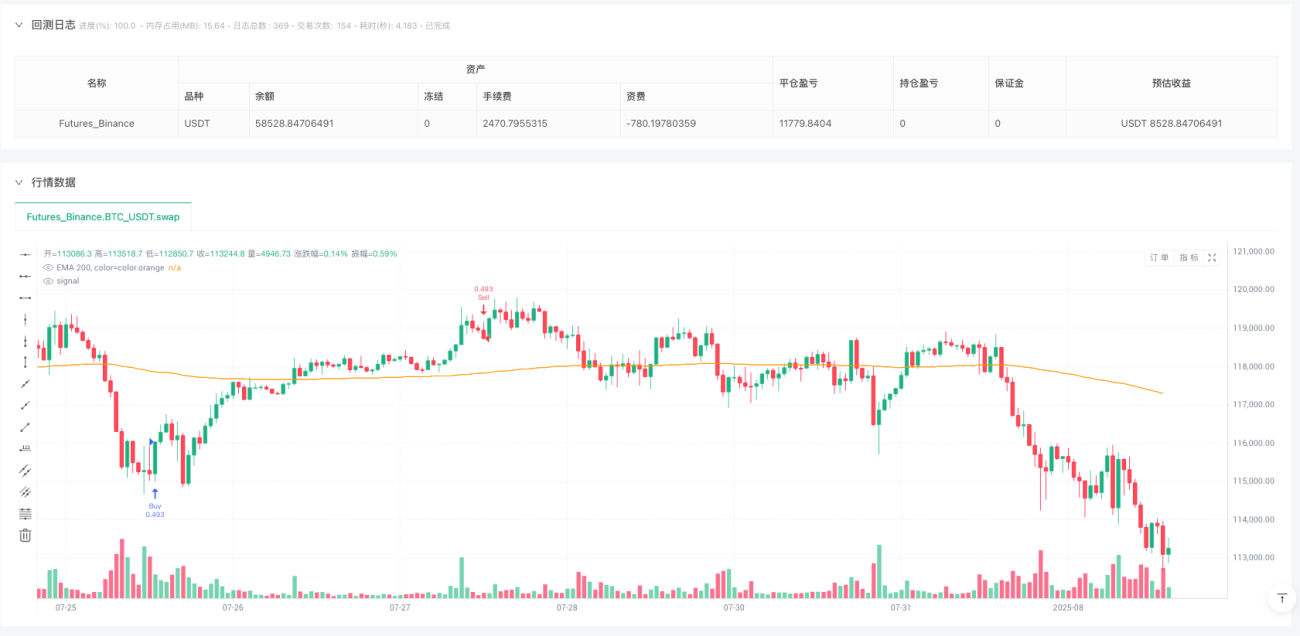
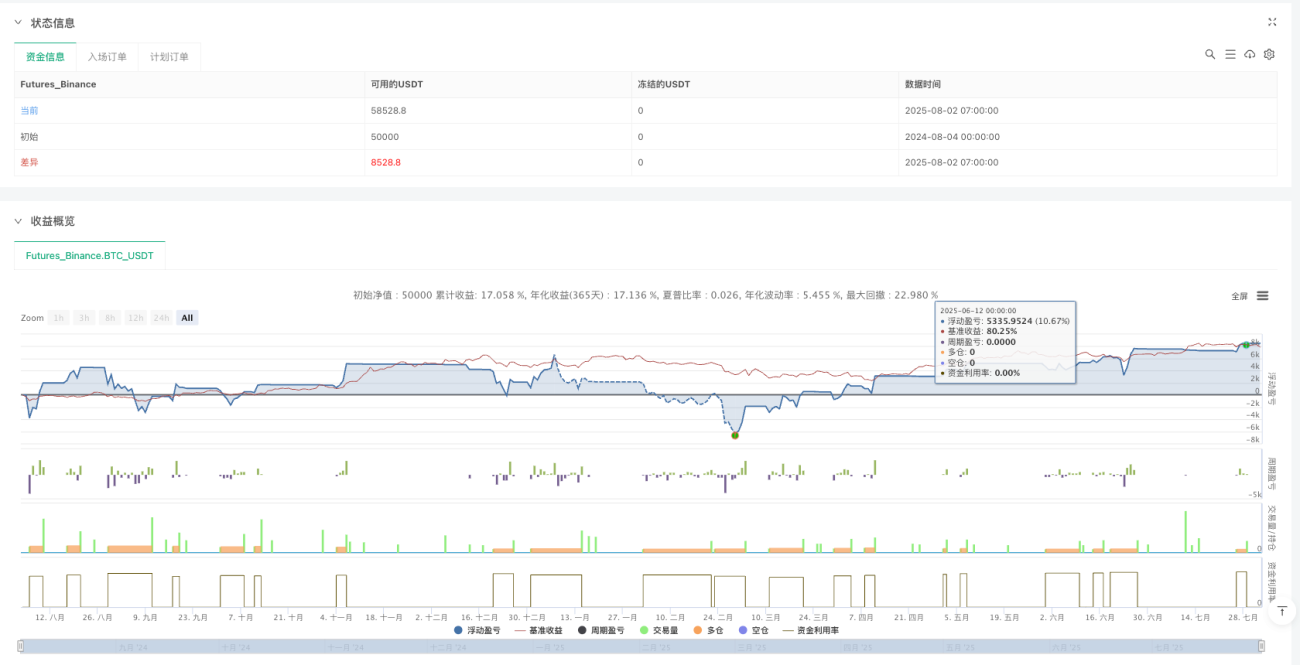
/*backtest
start: 2024-08-04 00:00:00
end: 2025-08-02 08:00:00
period: 1h
basePeriod: 1h
exchanges: [{"eid":"Futures_Binance","currency":"BTC_USDT"}]
*/

//@version=6
strategy("✅ BACKTEST: UT Bot + RSI", overlay=true, default_qty_type=strategy.percent_of_equity, default_qty_value=100)

rsiLen = input.int(14, "RSI Length")- 1