
Overview
The Dual Hull Moving Average Crossover Momentum Quantitative Strategy is a trend-following system based on the Hull Moving Average (HMA). This strategy utilizes the relationship between the standard HMA and a smoothed version (HMA3) to identify market trend changes and generate high-probability continuation and reversal signals in both bullish and bearish market conditions. By comparing these two moving averages with different smoothing characteristics, the strategy effectively reduces market noise while maintaining sensitivity to changes in price momentum. The system generates clear long and short signals through crossover logic and implements automated trading decisions using TradingView's strategy engine.
Strategy Principle
The core principle of this strategy is to compare the relative positions and crossovers between two Hull Moving Averages calculated using different methods. The specific implementation is as follows:
-
Standard HMA (variable a): Uses the original algorithm developed by William Hull, which achieves a more responsive moving average through a three-step calculation process:
- Calculate a WMA with period length
- Calculate a WMA with period length/2
- Subtract the long-period WMA from twice the short-period WMA to get the raw HMA
- Apply a final WMA smoothing with period √length to the raw HMA
-
Smoothed HMA3 (variable b): Employs a more complex smoothing algorithm through a combination of multiple WMAs:
- Uses length/2 as the base period p
- Combines three different period WMAs (p/3, p/2, and p) into a weighted average
- Applies a final WMA smoothing with period p to the result
-
Signal generation logic:
- When line b crosses above line a (b > a and b[1] < a[1]), a buy signal is generated
- When line a crosses above line b (a > b and a[1] < b[1]), a sell signal is generated
-
Strategy execution logic:
- When a buy signal appears, close any short positions first, then open a long position
- When a sell signal appears, close any long positions first, then open a short position
The strategy also includes visualization components, such as moving average lines that change color based on trend direction and clear buy/sell signal markers, helping traders intuitively understand market conditions.
Strategy Advantages
-
Reduced market noise: The dual HMA system effectively filters short-term price fluctuations, reducing false signals while maintaining sensitivity to genuine trend changes. The standard HMA itself is already more responsive than traditional moving averages, and the combination with the smoothed HMA further improves signal quality.
-
Early trend identification: Due to the characteristics of the Hull Moving Average algorithm, this strategy can identify trend changes earlier than traditional moving averages, providing better entry timing.
-
Clear visual feedback: The strategy provides intuitive color coding (green for bullish, red for bearish) and buy/sell signal markers, allowing traders to quickly assess market conditions.
-
Complete trading mechanism: The strategy not only provides signals but also includes comprehensive position management logic, automatically handling position opening and closing, achieving true automated trading.
-
Flexible parameter configuration: Users can adjust the HMA length and price source according to personal preferences and market characteristics to adapt to different trading styles and market environments.
-
High computational efficiency: Compared to complex multi-indicator systems, this strategy uses relatively simple mathematical calculations, reducing the risk of overfitting while maintaining execution efficiency.
Strategy Risks
-
False signals in ranging markets: Although the dual HMA system reduces noise, it may still generate frequent crossover signals in sideways markets with no clear trend, leading to consecutive losing trades. Consider adding additional filtering conditions, such as volatility indicators or trend strength confirmation.
-
Lag issues: While HMA has less lag than traditional moving averages, any system based on moving averages still has some degree of lag, which may cause missed optimal entry or exit points in volatile markets.
-
Parameter sensitivity: Strategy performance is highly dependent on the selected HMA length parameter, and different markets and timeframes may require different optimal parameters. Comprehensive backtesting is recommended to determine the best parameters for specific market environments.
-
Lack of stop-loss mechanism: The current strategy implementation does not integrate stop-loss functionality, which may lead to significant drawdowns in cases of sudden trend reversals. Consider adding stop-loss conditions, such as ATR-based stops or time-based stops.
-
Single indicator dependency: The strategy relies solely on the HMA indicator, lacking multidimensional market analysis, which may underperform in certain market conditions. Consider combining other types of indicators, such as momentum or volatility indicators, to improve strategy robustness.
Strategy Optimization Directions
-
Add trend filters: Introduce additional trend confirmation indicators, such as ADX (Average Directional Index), to execute trades only when a strong trend is confirmed, avoiding frequent trades in sideways markets. This can be implemented by considering HMA crossover signals only when the ADX value is above a threshold (e.g., 25).
-
Integrate volatility adaptation mechanisms: Dynamically adjust HMA parameters based on market volatility, using longer periods in high-volatility environments and shorter periods in low-volatility environments. This can be achieved by calculating ATR (Average True Range) and mapping it to the HMA length parameter.
-
Implement smart stop-loss mechanisms: Add ATR-based stop-losses or use trailing stops, such as setting stop-loss points that follow the reverse movement of the HMA, to protect existing profits and limit potential losses.
-
Introduce volume confirmation: Incorporate volume indicators into the signal generation logic, requiring buy signals to be accompanied by increased volume, enhancing signal reliability. This can be done by checking if volume is higher than its n-day average.
-
Optimize position management: Implement risk-based position sizing adjustments instead of fixed percentage investments. Position size can be calculated based on ATR to ensure consistent risk exposure per trade.
-
Add time filters: Consider market time characteristics to avoid known inefficient trading periods, such as the Asian lunch hour or high-volatility periods before and after US non-farm payroll data releases.
-
Add pullback entry logic: After confirming the trend direction, wait for small pullbacks before entering, rather than entering directly at the crossover point, potentially getting better entry prices. This can be implemented by detecting the distance between price and the HMA.
Summary
The Dual Hull Moving Average Crossover Momentum Quantitative Strategy is an elegantly designed trend-following system that utilizes the relationship between two HMA indicators calculated using different methods to provide clear long and short signals. By comparing the relative positions and crossovers between the standard HMA and the smoothed HMA3, the strategy effectively reduces market noise while maintaining sensitivity to changes in price momentum. The strategy's strengths lie in its clear signal generation logic, intuitive visual feedback, and complete trading mechanism.
However, the strategy also faces risks such as frequent false signals in ranging markets, high parameter sensitivity, and lack of stop-loss mechanisms. Through optimizations like adding trend filters, integrating volatility adaptation mechanisms, implementing smart stop-losses, and introducing volume confirmation, the strategy's robustness and profitability can be significantly improved. Most importantly, traders should conduct comprehensive backtesting and parameter optimization based on their risk tolerance and trading objectives to find the most suitable configuration for specific market environments.
Overall, this is a quantitative strategy framework with solid foundations and good scalability, suitable for medium to long-term trend-following traders, and can also serve as a core component of more complex trading systems.
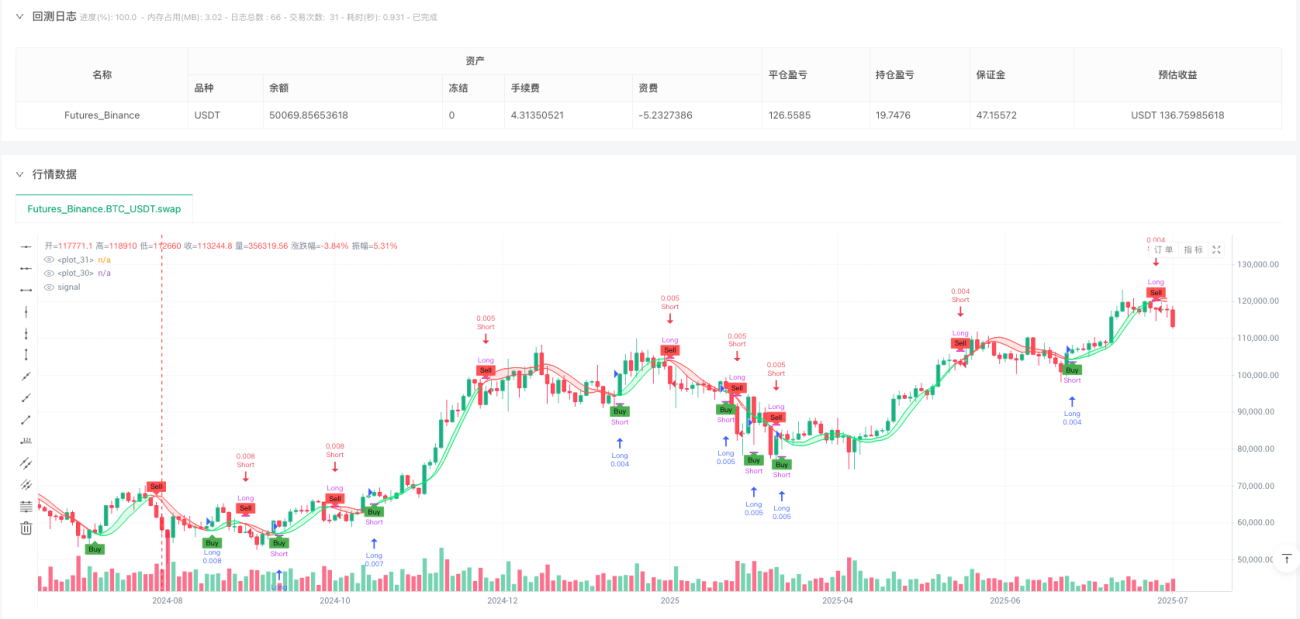
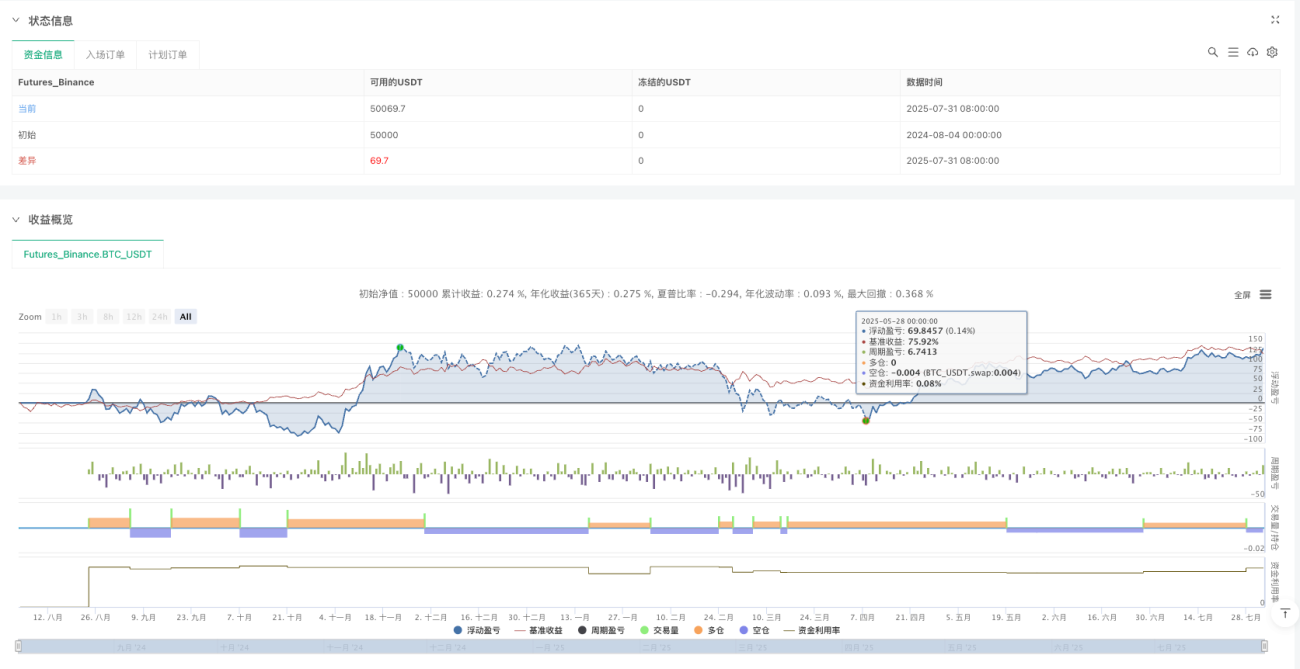
/*backtest
start: 2024-08-04 00:00:00
end: 2025-08-02 08:00:00
period: 2d
basePeriod: 2d
exchanges: [{"eid":"Futures_Binance","currency":"BTC_USDT"}]
*/

//@version=6
strategy("HMA Strat", shorttitle="HMAstrat", overlay=true, default_qty_type=strategy.percent_of_equity, default_qty_value=1)

// === INPUTS ===- 1