Multi-Timeframe MACD Momentum Breakout Quantitative Strategy

Overview
The Multi-Timeframe MACD Momentum Breakout Quantitative Strategy is a finely designed scalping system that provides high-precision entry points and favorable risk-reward ratios by optimizing the classic MACD indicator combined with trend and volatility filters. This strategy is particularly suitable for short-term trading on lower timeframes such as 1-minute, 5-minute, or 15-minute charts and can be applied to various financial assets.
The strategy employs a multi-timeframe (MTF) approach to calculate MACD, Signal Line, and Histogram, executing trades when specific conditions are met. These conditions include MACD crossing the Signal Line, changes in histogram momentum, price position relative to the 200 EMA, and market volatility as measured by the ATR indicator. Through these stringent filtering conditions, the strategy emphasizes quality over quantity, avoiding weak signals and improving win rate and profit factor.
Strategy Principles
The core logic of this strategy is based on multi-timeframe MACD momentum breakout signals, combined with trend confirmation and volatility filtering. The specific principles are as follows:
-
Multi-Timeframe MACD Calculation: Uses the request.security function to obtain MACD, Signal Line, and Histogram values for a specific timeframe, allowing traders to use higher timeframe MACD signals on lower timeframe charts.
-
Entry Conditions:
- Long Entry: MACD crosses above the Signal Line, Histogram is rising and exceeds the set impulse threshold, price is above the 200 EMA confirming an uptrend, and ATR confirms sufficient volatility.
- Short Entry: MACD crosses below the Signal Line, Histogram is falling and exceeds the set impulse threshold, price is below the 200 EMA confirming a downtrend, and ATR confirms sufficient volatility.
-
Risk Management:
- Profit targets are set higher than stop losses, ensuring that average wins are larger than average losses.
- Optional trailing stop feature to capture more profit in strong market moves.
- Fixed contract quantity of 1, suitable for low-risk exposure in scalping.
-
Parameter Optimization:
- Customizable MACD Fast, Slow, and Signal Line parameters.
- Adjustable Histogram impulse threshold and minimum ATR filter.
- Configurable Take Profit, Stop Loss percentages, and Trailing Stop activation conditions.
- Option to use current chart resolution or custom timeframe.
The uniqueness of this strategy lies in its combination of technical indicators with multiple filtering conditions, ensuring that trades are only executed when high-probability opportunities arise, effectively reducing false signals and unnecessary trades.
Strategy Advantages
After in-depth code analysis, this strategy demonstrates several significant advantages:
-
Multiple Confirmation Mechanism: Combines MACD crossovers, histogram momentum, trend direction, and volatility filtering to significantly reduce false signals and improve trade quality. The code uses combinations of conditions such as macdCrossUp/Down, histImpulseUp/Down, trendUp/Down, and volatilityOK to confirm signals.
-
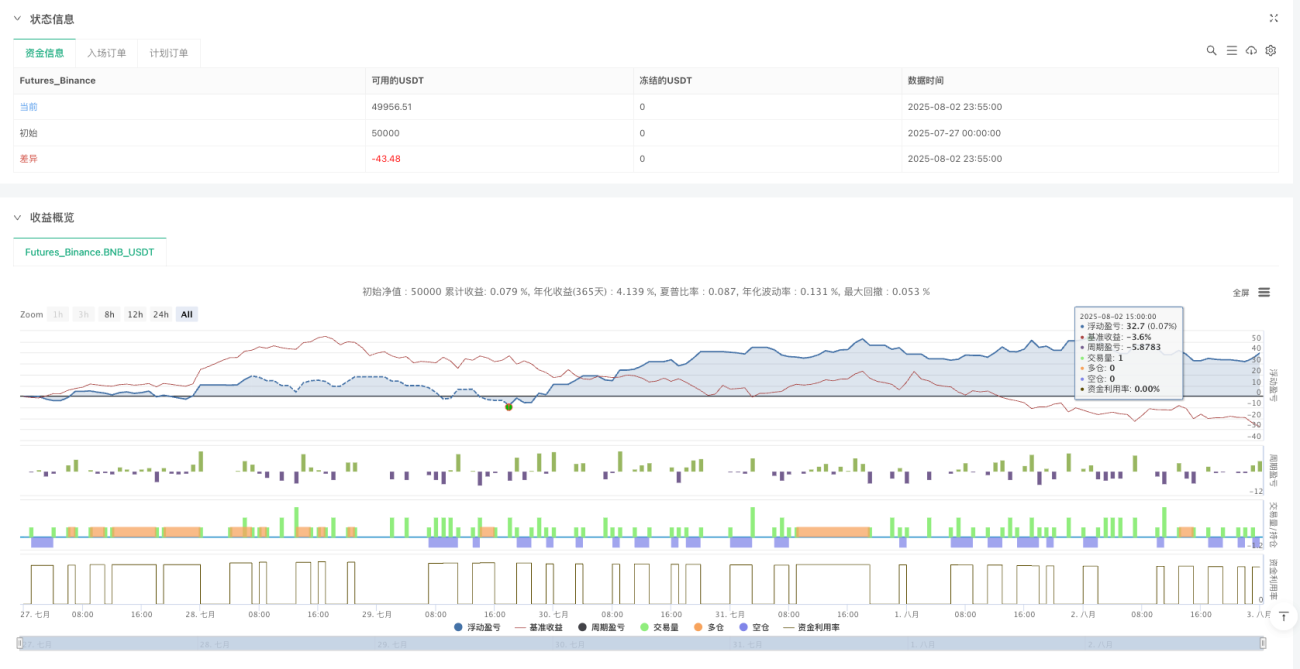
Adjustable Risk Management: Provides flexible stop-loss/take-profit settings and optional trailing stop functionality, allowing traders to adjust according to market conditions and personal risk preferences. The takeProfitPerc, stopLossPerc, and trailingPerc parameters make risk management highly customizable.
-
Multi-Timeframe Analysis: The MTF analysis implemented through the request.security function allows the use of higher timeframe MACD signals on lower timeframe charts, reducing noise and capturing stronger trend movements.
-
Histogram Impulse Filtering: Uses the histThreshold parameter to set minimum histogram impulse requirements, ensuring that only strong momentum changes are captured, not weak fluctuations. This is implemented in the code through histImpulseUp and histImpulseDown conditions.
-
Volatility Adaptability: Uses the ATR indicator to ensure the market has sufficient volatility to support scalping, avoiding trading in markets with insufficient volatility. The minATR parameter allows adjustment of this filter's sensitivity.
-
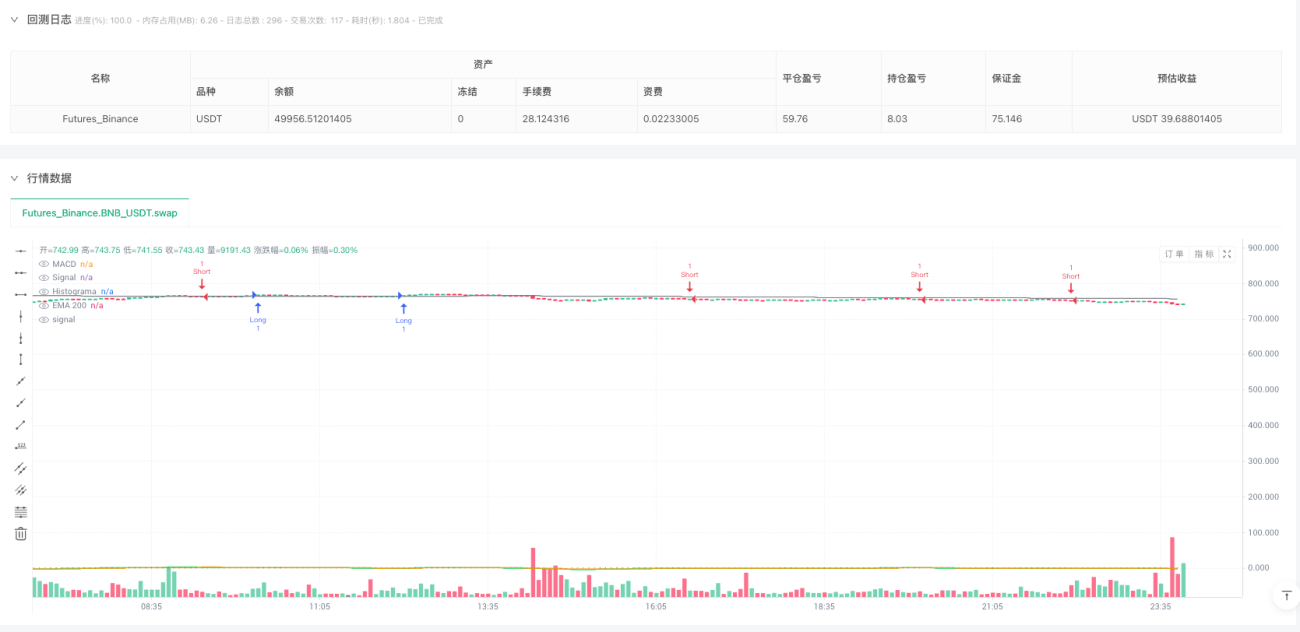
Visual Aids: Provides graphical display of MACD, Signal Line, Histogram, and 200 EMA, helping traders visualize strategy signals and market conditions for real-time monitoring and analysis.
-
Universal Applicability: Can be applied to various financial assets and timeframes, particularly suitable for markets with moderate volatility such as gold, indices, cryptocurrencies, and high-liquidity stocks.
Strategy Risks
Despite its well-designed nature, the strategy still has some potential risks:
-
Parameter Sensitivity: Settings such as MACD parameters, histogram threshold, and ATR filter significantly impact strategy performance. Improper parameter settings may lead to overtrading or missing important signals. The solution is to optimize parameters through backtesting under different market conditions to find the optimal balance.
-
Fast Market Risk: In highly volatile or rapidly changing markets, prices may fluctuate significantly before triggering stop losses, causing losses to exceed expectations. Consider increasing stop loss ranges or temporarily ceasing trading in particularly volatile market conditions.
-
Trend Reversal Delay: Relying on the 200 EMA as a trend filter may lead to missed trading opportunities in the early stages of trend reversals. Consider adding more sensitive trend indicators or using combinations of multiple moving averages to improve trend identification.
-
Timeframe Dependency: The effectiveness of the multi-timeframe approach depends on the combination of selected timeframes. Incompatible timeframe settings may lead to contradictory signals. It is recommended to determine the most suitable timeframe combination for specific trading instruments through backtesting.
-
Fixed Contract Risk: The strategy uses a fixed number of contracts (default_qty_value=1), without adjusting position size based on market volatility or account size, which may not be suitable for all account sizes. Implementing position management based on volatility or account proportion can improve risk control.
-
Signal Congestion: In certain market conditions, there may be too many or too few signals, leading to unstable trading frequency. Consider adding trade interval restrictions or signal strength filters to control trading frequency.
Strategy Optimization Directions
Based on code analysis, the strategy has several possible optimization directions:
-
Dynamic Parameter Adjustment: Implement a mechanism to automatically adjust MACD parameters and filter thresholds based on market conditions. For example, increase histThreshold and minATR values in high-volatility markets and decrease these values in low-volatility markets. This can improve the strategy's adaptability in different market environments.
-
Improved Position Management: Introduce dynamic position management based on ATR or account equity percentage, replacing the current fixed contract quantity setting. This allows adjusting risk exposure based on market volatility and account size, improving capital management efficiency.
-
Add Trading Session Filtering: Add trading session restrictions to avoid trading during low-liquidity or high-uncertainty periods (such as market opening, closing, or before and after important news releases). This can be implemented by checking the current trading time and setting allowed time windows for trading.
-
Integrate Price Action Analysis: Combine candlestick patterns or price pattern recognition to provide additional confirmation for MACD signals. For example, only accept MACD signals when bullish/bearish candlestick patterns appear, or require stricter conditions when trading near key support/resistance levels.
-
Add Volume Confirmation: Use volume indicators as additional filtering conditions to ensure trading only occurs with volume support. This is particularly useful for confirming price breakouts and trend changes.
-
Optimize Trailing Stop Mechanism: The current trailing stop is a fixed percentage, which can be improved to a dynamic trailing stop based on ATR or price volatility, better adapting to changing market conditions.
-
Add Market State Classification: Implement market state recognition (trending, ranging, or high volatility) and adjust strategy parameters or even switch trading logic based on different market states. For example, reversal strategies might be more suitable in ranging markets than trend following.
-
Add Machine Learning Optimization: Consider using machine learning algorithms to optimize parameter selection or predict signal quality, enhancing the strategy's intelligence and adaptability. While this exceeds the basic functionality of Pine Script, it can be implemented in combination with external systems.
These optimization directions aim to improve the strategy's robustness, adaptability, and profitability while reducing unnecessary risk exposure.
Summary
The Multi-Timeframe MACD Momentum Breakout Quantitative Strategy is a carefully designed scalping system that provides high-quality trading signals through the comprehensive application of multi-timeframe MACD analysis, histogram momentum confirmation, and trend and volatility filters. The strategy particularly emphasizes signal quality over quantity, aiming to improve win rate and overall profitability through strict entry conditions and flexible risk management.
The main features of the strategy include multiple confirmation mechanisms, adjustable risk management parameters, multi-timeframe analysis, and volatility adaptability, making it suitable for short-term trading across various financial assets. At the same time, through clear visual aids, traders can easily monitor and analyze strategy signals and market conditions.
Despite potential risks such as parameter sensitivity, fast market risk, and trend reversal delay, these risks can be mitigated and managed through parameter optimization, dynamic position management, trading session filtering, and integration with other technical analysis tools.
By deeply understanding the principles and characteristics of this strategy, traders can make appropriate parameter adjustments based on their trading style and goals, or further optimize on the existing framework to build a more personalized and effective trading system. Whether experienced traders or beginners, this MACD momentum-based quantitative strategy provides a structured and systematic trading approach that helps reduce the influence of emotional factors and improves trading consistency and discipline.
- 1