
Overview
This strategy is a trend-following system based on Exponential Moving Average (EMA) combined with dynamic slope angle analysis to precisely detect market trend direction and transition points. The core objective of this strategy is to minimize false signals by clearly identifying three market states: uptrend, downtrend, and sideways consolidation. The system also integrates an optional candle smoothing logic calculation module, effectively filtering market noise and improving signal reliability in volatile environments. This strategy is applicable across various timeframes, performing exceptionally well on 15-minute to 1-hour charts, providing traders with a powerful tool that can be used both independently and as a foundation for multi-indicator systems.
Strategy Principles
The strategy is based on three key technical elements for market classification and signal generation:
-
EMA Slope Angle Analysis: The strategy calculates the slope angle of the EMA line, using the mathematical function
math.atanto convert price movements into angular values. This method is more precise than simple direction determination, able to quantify trend strength. -
Price Position Relative to EMA: The system monitors whether the price is above or below the EMA, which is a basic indicator for determining if the market leans bullish or bearish.
-
Market State Classification System: Based on the above two factors, the strategy classifies the market into three states:
- Uptrend (green): Price is above EMA and EMA slope is positive
- Downtrend (red): Price is below EMA and EMA slope is negative
- Sideways consolidation (blue): EMA slope is close to zero or price and slope direction are inconsistent
The trading signal generation logic adopts a dual-layer structure:
- First type of signal: Transition from sideways (blue) to trend state (red/green)
- Second type of signal: Direct transition from one trend to another without going through sideways
The strategy also provides a built-in candle smoothing calculation option, which can use smoothed candle logic internally for calculations while displaying regular candles. This unique combination preserves both the noise-filtering advantages of smoothed candles and the precise execution capabilities of regular candles.
Strategy Advantages
Through in-depth analysis of the code, the strategy demonstrates the following significant advantages:
-
Noise Filtering Capability: By combining EMA, slope analysis, and optional candle smoothing logic, the strategy can effectively reduce false signals caused by market noise, especially in sideways markets.
-
Precise Trend Transition Capture: The dual-layer signal logic design can capture transition points from sideways to trend, as well as direct trend reversals, providing more comprehensive market entry opportunities.
-
Visual Intuition: The strategy uses a color-coding system (green, red, blue) to make market states clear at a glance, allowing traders to intuitively judge the current market environment.
-
Strong Adaptability: The strategy can be applied in different market conditions and timeframes, suitable for both short-term trading and medium to long-term investment.
-
Simple Parameters: Only requiring adjustment of EMA length and whether to enable candle smoothing calculation, it reduces the risk of over-optimization and curve fitting.
-
High Flexibility: The strategy can be used as an independent trading system or as a filter or basic component for other trading strategies.
-
Built-in Risk Control: The code includes position closing logic, automatically closing positions when signals reverse, providing a basic risk management mechanism.
Strategy Risks
Despite being well-designed, the strategy still has the following potential risks and challenges:
-
Delayed Trend Identification: Due to using EMA as the core indicator, the strategy may have a certain lag in the initial stages of trends, leading to missing part of the price movement in rapidly reversing markets. The solution is to consider adjusting the EMA length or combining with faster indicators.
-
Sideways Oscillation Risk: In long-term sideways markets, even with the candle smoothing option enabled, the strategy may still produce consecutive small loss trades. It is recommended to use in clear trend markets or add filtering conditions for sideways identification.
-
Parameter Sensitivity: The choice of EMA length has a significant impact on strategy performance, and different markets and timeframes may require different parameter settings. It is recommended to determine the optimal parameter combination through historical backtesting.
-
Lack of Stop-Loss Mechanism: There is no explicit stop-loss logic in the current code, relying only on signal reversal for position closing, which may lead to larger losses in extreme market fluctuations. A stop-loss mechanism based on volatility or fixed proportion should be added.
-
Signal Frequency Issues: In highly volatile markets, the strategy may produce too many trading signals, increasing trading costs. Consider adding signal confirmation mechanisms or delayed execution conditions.
Strategy Optimization Directions
Based on code analysis, here are the potential optimization directions for this strategy:
-
Multi-Timeframe Confirmation: Implement a multi-timeframe analysis framework, requiring short-term and long-term trend directions to be consistent before generating signals, which will significantly improve signal quality. This optimization is important because it can reduce false signals that might be produced by a single timeframe.
-
Dynamic Parameter Adjustment: Automatically adjust EMA length and slope thresholds based on market volatility, allowing the strategy to better adapt to different market environments. Using shorter EMAs in low volatility environments and longer EMAs in high volatility environments can improve the strategy's adaptability.
-
Advanced Take-Profit and Stop-Loss Mechanisms: Introduce dynamic stop-loss and trailing take-profit based on ATR (Average True Range) to optimize risk-reward ratio. These mechanisms can maximize profit potential while protecting capital.
-
Volume Analysis Integration: Use volume data as an auxiliary confirmation indicator to improve the accuracy of trend identification, especially at important turning points.
-
Volatility Filter: Add a volatility-based filtering mechanism to pause trading in extremely high or low volatility environments, preventing losses in unfavorable market conditions.
-
Entry Timing Optimization: The current strategy enters immediately after confirming a trend; it could be optimized to wait for a small pullback before entering, improving entry price advantage.
-
Smoothing Algorithm Improvement: The current standard candle smoothing calculation could be explored with other smoothing algorithms such as Ehlers filters or adaptive moving averages to further improve trend identification accuracy.
Conclusion
The EMA Trend-Box Strategy with Candle Smoothing Optimization System is an elegantly designed trend-following solution that provides a simple yet effective market state classification and trading signal generation mechanism by combining EMA, slope angle analysis, and candle smoothing technology. The main advantages of the strategy lie in its noise filtering capability and precision in capturing trend transitions, making it valuable in various market environments.
However, the strategy also has limitations such as delayed trend identification and lack of comprehensive stop-loss mechanisms. The performance of the strategy can be further enhanced through implementing multi-timeframe analysis, dynamic parameter adjustment, advanced stop-loss mechanisms, and volume analysis. For traders seeking reliable trend-following systems, this strategy provides a solid foundation that can be used independently or as a core component of more complex trading systems.
Whether novice or experienced, traders can benefit from this strategy's clear logic and flexibility. With appropriate parameter adjustments and optional optimizations, the strategy can adapt to different trading styles and market conditions, becoming a powerful weapon in a trader's toolkit.
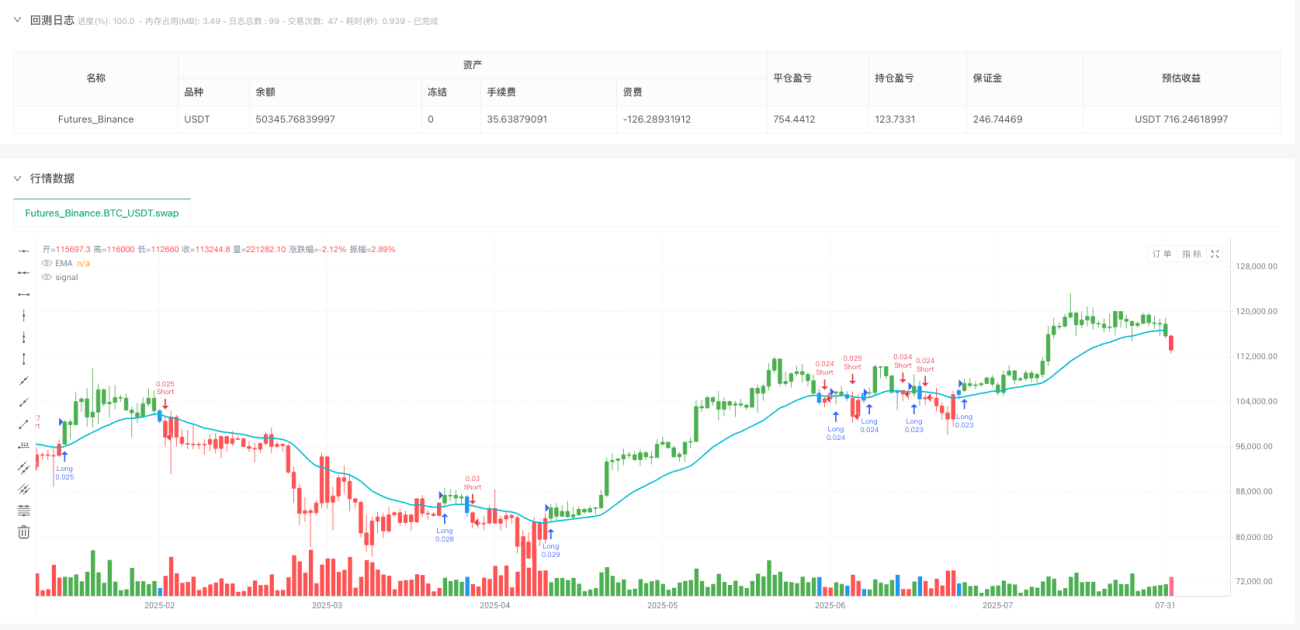
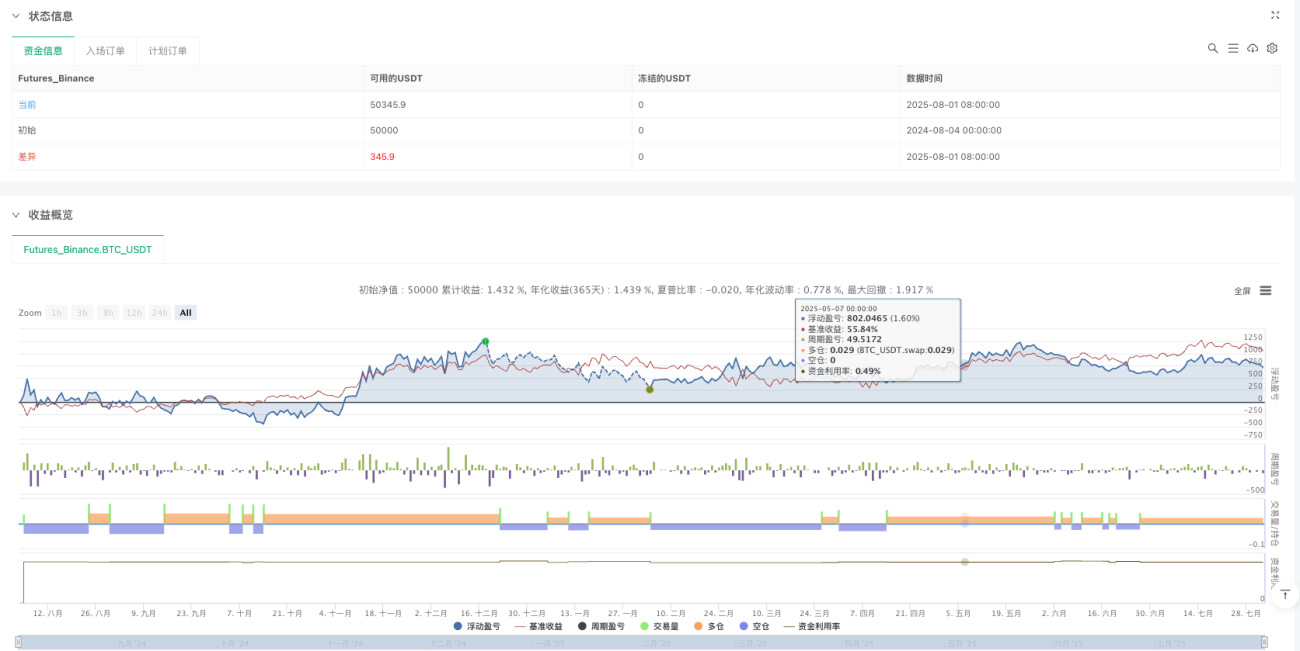
/*backtest
start: 2024-08-04 00:00:00
end: 2025-08-02 08:00:00
period: 1d
basePeriod: 1d
exchanges: [{"eid":"Futures_Binance","currency":"BTC_USDT"}]
*/

//@version=6
strategy(title='EMA Trend-box Strategy with Heikin Ashi Option', overlay=true, default_qty_type=strategy.percent_of_equity, default_qty_value=5)

// === Heikin Ashi izračunavanje ===- 1