Fisher Transform Crossover Strategy: Gaussian Distribution-Optimized Momentum Trading System

Overview
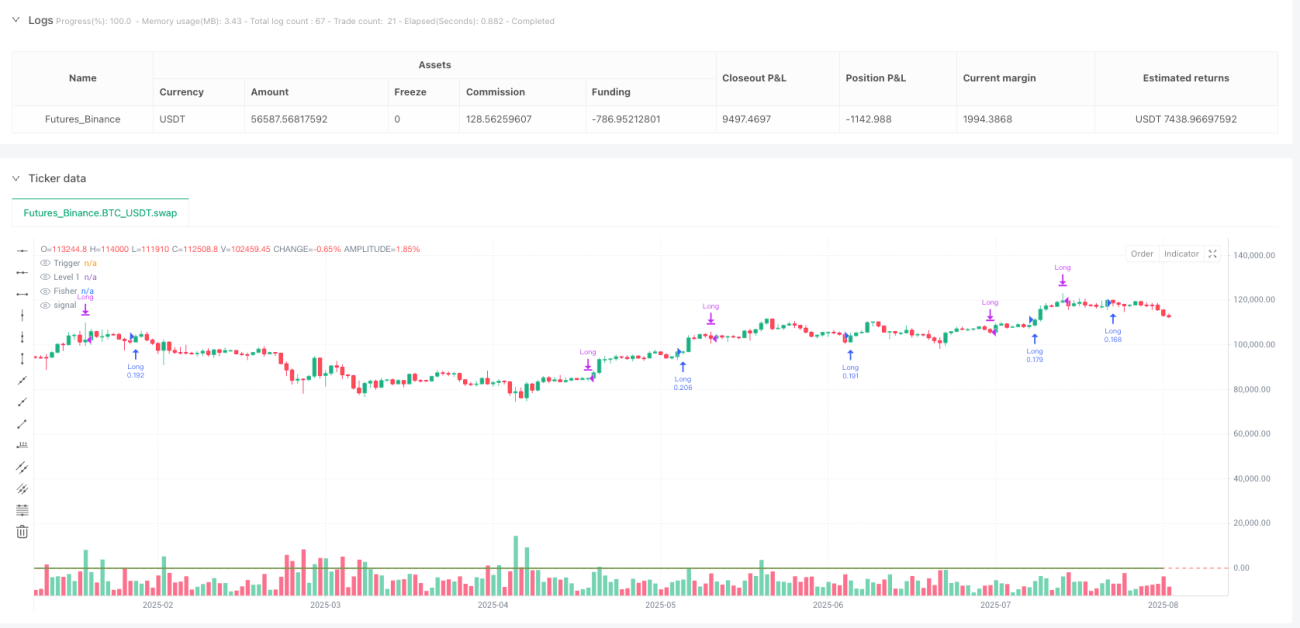
The Fisher Transform Crossover Strategy is a technical trading method based on the Fisher Transform indicator developed by John Ehlers. This strategy utilizes a mathematical transformation to convert price data into a normal Gaussian distribution, making market turning points more distinct and easier to identify. The core of the strategy relies on crossover signals between two lines: the Fisher line (the main transformed price value) and the Trigger line (a one-period lag of the Fisher line). A buy signal is generated when the Fisher line crosses above the Trigger line and the Fisher value is below 1, indicating the potential start of bullish momentum; a sell signal occurs when the Fisher line crosses below the Trigger line and the Fisher value is above 1, suggesting a possible bearish reversal. This strategy executes only one trade at a time and confirms entries and exits only at candle close to reduce false signals. Trading is conducted using a fixed cash amount (₹20,000) and the strategy is applied directly on the price chart. The Fisher line is plotted in green, the Trigger line in red, and a horizontal reference line is set at level 1 to help visually identify overbought or strong momentum conditions.
Strategy Principles
The core principle of the Fisher Transform Crossover Strategy is to utilize the Fisher Transform to convert price data into a normal distribution. The specific implementation process is as follows:
- First, the strategy sets the length of the Fisher Transform using an input parameter (default is 9 periods).
- Calculate the raw value: by normalizing the current closing price relative to the highest and lowest prices within the period, then applying a weighted average (weight of 0.33 for the current value, weight of 0.67 for the previous value).
- Apply the Fisher Transform: using the formula 0.5 * log((1 + value) / (1 - value)) to convert the normalized value into a Fisher value, then apply smoothing.
- The Trigger line is set as the previous period's value of the Fisher line.
- Trading conditions are clearly defined:
- A buy signal is generated when the Fisher line crosses above the Trigger line and the Fisher value is less than 1
- A sell signal is generated when the Fisher line crosses below the Trigger line and the Fisher value is greater than 1
- The strategy ensures only one trade at a time and confirms trading signals only at candle close.
This design allows the strategy to capture changes in market momentum, especially in the early stages of price reversals. The mathematical properties of the Fisher Transform make market turning points more prominent, helping traders identify potential reversal opportunities in advance.
Strategy Advantages
The Fisher Transform Crossover Strategy has the following significant advantages:
- Early identification of reversals: The mathematical properties of the Fisher Transform make market turning points appear earlier than many other indicators, allowing traders to enter the market at the beginning of trends.
- Clear entry and exit rules: The strategy provides definitive trading signals without the need for subjective judgment, suitable for systematic trading.
- Reduced false signals: By confirming signals only at candle close, the strategy reduces the risk of false breakouts during trading sessions.
- Smoothing process: The calculation process of the Fisher Transform includes smoothing, reducing the impact of market noise.
- Wide applicability: The strategy can be applied to various markets, including stocks, forex, commodities, and cryptocurrencies.
- Visual intuitiveness: The strategy clearly marks the Fisher line and Trigger line on the chart, allowing traders to easily identify crossover points and potential trading opportunities.
- Integrated risk control: By limiting trades near level 1, the strategy incorporates certain risk management mechanisms to avoid entering in extreme market conditions.
- Single trade management: The strategy is designed to manage only one trade at a time, simplifying the trade management process.
Strategy Risks
Despite the many advantages of the Fisher Transform Crossover Strategy, there are also some potential risks:
- False signals in ranging markets: In sideways or ranging markets, the Fisher line and Trigger line may cross frequently, generating numerous false signals leading to consecutive losses.
- Lagging nature: Although the Fisher Transform helps identify turning points early, as an indicator based on historical data, it still has a certain degree of lag.
- Parameter sensitivity: The choice of Fisher length parameter can significantly affect strategy performance, with inappropriate parameters potentially leading to excessive or insufficient sensitivity.
- Risk of rapid market reversals: In volatile markets, prices may quickly reverse before signal confirmation, resulting in less than ideal entry points.
- Fixed fund management limitations: The strategy uses a fixed cash amount for trading, which may not be suitable for all account sizes or risk preferences.
- Over-reliance on a single indicator: Relying solely on Fisher crossovers may ignore other important market factors such as fundamental changes, market structure, or overall trend direction.
To mitigate these risks, traders can consider combining other technical tools such as support and resistance levels, volume analysis, or moving averages, and implementing appropriate stop-loss and take-profit levels.
Strategy Optimization Directions
For the Fisher Transform Crossover Strategy, here are several possible optimization directions:
- Dynamic parameter adjustment: Automatically adjust the Fisher length parameter based on market volatility, using longer periods in low-volatility markets and shorter periods in high-volatility markets.
- Multi-timeframe confirmation: Verify trading signals on larger timeframes, executing trades only when multiple timeframes show consistent signals.
- Filter integration: Add trend filters (such as moving averages) or volatility filters to trade only under favorable market conditions.
- Dynamic position management: Implement dynamic position management based on market volatility or account size, rather than using a fixed cash amount.
- Enhanced exit strategies: In addition to crossover exit signals, add auxiliary exit mechanisms based on trailing stops or profit targets.
- Market state differentiation: Implement market state detection algorithms to reduce or avoid trading in ranging markets and actively trade only in clearly trending markets.
- Signal strength grading: Grade signals based on the angle and distance of the Fisher line and Trigger line crossover, executing only high-confidence signals.
- Complementary indicators: Combine with other momentum or trend indicators (such as RSI, MACD, or ADX) for signal confirmation, improving the robustness of the strategy.
These optimizations can enhance the strategy's adaptability in different market conditions, reduce false signals, and improve overall risk-reward characteristics.
Summary
The Fisher Transform Crossover Strategy is a momentum trading system based on mathematical transformation, converting price data into a normal distribution to make market turning points more clearly identifiable. The strategy uses the crossover of the Fisher line and Trigger line as trading signals, buying when the Fisher line crosses above the Trigger line and the Fisher value is less than 1, and selling when the Fisher line crosses below the Trigger line and the Fisher value is greater than 1. The main advantages of the strategy include early identification of market reversals, clear trading rules, reduced false signals, and applicability to various markets. However, it may generate false signals in ranging markets, has parameter sensitivity, and over-reliance on a single indicator may ignore other market factors. Optimization directions include dynamic parameter adjustment, multi-timeframe confirmation, filter integration, dynamic position management, and enhanced exit strategies. Overall, the Fisher Transform Crossover Strategy provides traders with a systematic approach based on mathematical principles to capture changes in market momentum and identify potential trading opportunities, but needs to be applied carefully and accompanied by appropriate risk management measures.
- 1