
Overview
The Parabolic SAR with Early Trend Detection and MA Integrated Exit Strategy is an advanced quantitative trading system designed to capture early trend reversals and implement intelligent exits through dynamic moving average filtering. The core of the strategy combines the Parabolic SAR (Stop and Reverse) indicator to identify trend change points and uses SMA (Simple Moving Average) as an auxiliary exit condition, forming a complete trading loop. The strategy enters long trades when a SAR reversal occurs and exits only when the SAR moves above the price and the price falls below the 11-period SMA, effectively avoiding premature exits during volatile swings, enhancing the strategy's robustness and profitability.
Strategy Principles
The core principles of this strategy are based on customized calculation and dynamic adjustment mechanisms of the Parabolic SAR indicator. The specific implementation process is as follows:
-
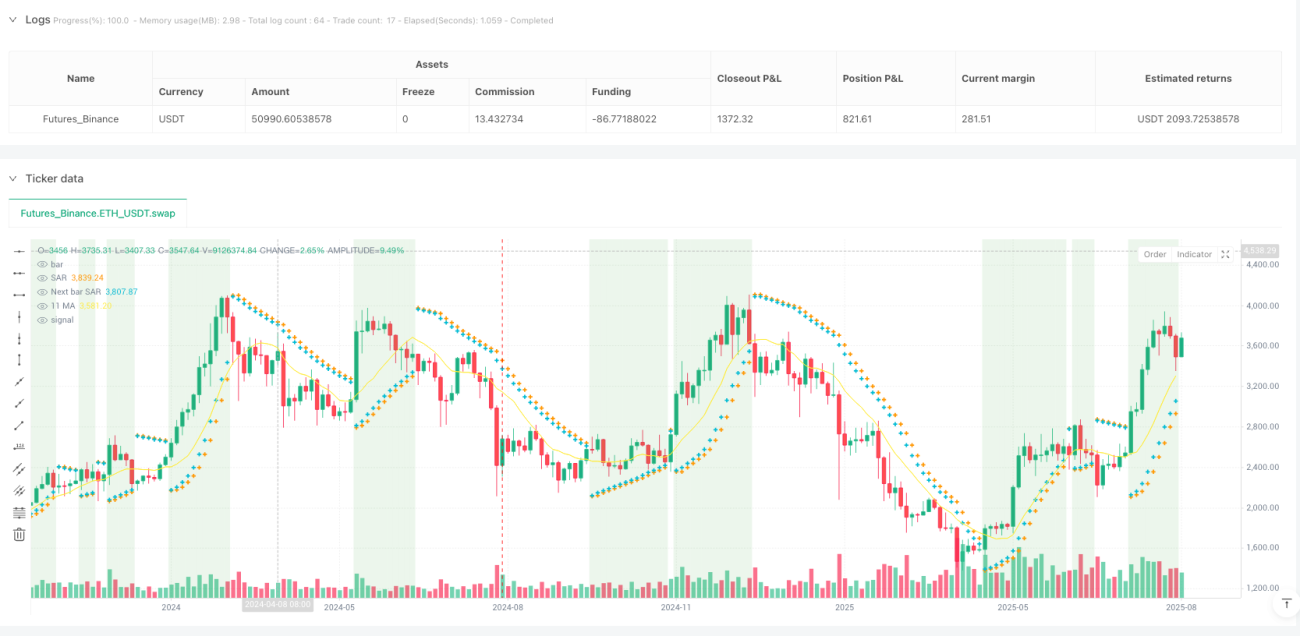
SAR Calculation and Trend Determination: The strategy uses a customized method to calculate SAR values, controlling indicator sensitivity through three parameters: starting value (0.02), increment (0.02), and maximum value (0.2). The strategy uses the uptrend variable to track the current trend direction, EP (Extreme Point) to record price extremes, and AF (Acceleration Factor) to control the rate of SAR change.
-
Trend Reversal Identification: A trend reversal signal is triggered when the price breaks through the SAR value. If the current trend is upward and the SAR value is higher than the lowest price, or if the current trend is downward and the SAR value is lower than the highest price, the strategy will reset relevant parameters and switch trend direction.
-
Entry Signal Generation: The strategy sets stop-loss entry prices through the nextBarSAR value. In an uptrend, it generates short stop-loss entry orders; in a downtrend, it generates long stop-loss entry orders.
-
Integrated Exit Mechanism: This is the most critical innovation of the strategy. The strategy exits long positions only when dual conditions are met: SAR value is higher than the closing price (traditional SAR exit signal) and the closing price is lower than the 11-period SMA (trend weakening confirmation). This dual filtering mechanism avoids the problem of premature exits that may occur when relying solely on SAR.
-
Visual Assistance: The strategy plots SAR points, next bar SAR prediction values, and the 11-period SMA line on the chart, adds background highlights in buying zones (SAR below price), and draws red flags when exit conditions are met, enhancing the visualization of trading signals.
Strategy Advantages
-
Early Trend Capture Capability: Through finely adjusted SAR parameters and dynamic acceleration factors, the strategy can identify reversal signals in the early stages of trends, achieving better entry timing.
-
Reduced False Signal Interference: The dual exit conditions (SAR > price AND price < SMA) significantly reduce the risk of false signals that might be generated by a single indicator, avoiding premature exits during short-term price fluctuations.
-
Strong Adaptability: The AF (Acceleration Factor) in the strategy adjusts dynamically based on price extremes, allowing the SAR indicator to adapt to different market environments, following more closely in strong trends and maintaining appropriate distance in weak trends.
-
Built-in Stop-Loss Mechanism: SAR itself is a dynamic stop-loss mechanism that automatically adjusts stop-loss positions as trends develop, protecting existing profits and limiting potential losses.
-
Clear Visual Feedback: Through background highlights and graphical markers, the strategy provides intuitive visual feedback, enabling traders to easily identify current market conditions and potential trading signals.
-
Wide Applicability: The code comments indicate that this strategy is applicable to all timeframes and trading instruments, enhancing the strategy's practicality and flexibility.
Strategy Risks
-
Parameter Sensitivity: SAR parameters (starting value, increment, and maximum value) have a significant impact on strategy performance. Inappropriate parameter settings may cause signals to be either too sensitive or lagging, requiring optimization adjustments for different market environments.
-
Underperformance in Range-Bound Markets: Although the integrated exit mechanism reduces false signals, in sideways markets without clear trends, the strategy may generate frequent entry and exit signals, leading to increased trading costs and drawdowns.
-
Delayed Exit Risk: While dual exit conditions reduce false signals, they may also cause exit delays during sharp trend reversals, failing to protect profits in a timely manner.
-
Indicator Dependency: The strategy primarily relies on technical indicators without considering fundamental factors or market structure changes, potentially underperforming when major events affect the market.
-
Slippage and Liquidity Risk: The strategy uses stop orders for entry, which may face slippage issues in highly volatile or illiquid markets, where actual execution prices may differ from ideal signal prices.
Solutions:
- Optimize parameters through backtesting to find the best parameter combinations for specific market environments
- Add additional filtering conditions, such as volatility filters or trend strength confirmation, to reduce false signals in range-bound markets
- Consider adding trailing stops or partial profit-taking mechanisms to provide additional protection while maintaining dual exit conditions
- Integrate other indicators or market structure analysis to enhance the strategy's multidimensional judgment capability
- Optimize order execution strategies, such as using limit orders instead of stop market orders, to reduce slippage impact
Strategy Optimization Directions
-
Dynamic Parameter Adjustment: The current strategy uses fixed SAR parameters and MA periods. An important optimization direction is to introduce a dynamic parameter adjustment mechanism based on market volatility. For example, increase SAR maximum values and MA periods in high volatility environments and decrease these values in low volatility environments, allowing the strategy to better adapt to different market conditions.
-
Multi-Timeframe Confirmation: Introduce a multi-timeframe analysis framework, requiring entry signals to be supported by higher timeframe trends and exit signals to be confirmed by lower timeframes, improving signal quality and accuracy.
-
Volume Filter: Integrate volume analysis, confirming trend reversal signals only when supported by trading volume, filtering out potential false breakouts that occur during low volume periods.
-
Intelligent Money Management: Dynamically adjust position sizes based on volatility and signal strength, increasing positions on strong signals and reducing positions on weak signals, optimizing capital efficiency and risk-reward ratio.
-
Machine Learning Enhancement: Utilize machine learning algorithms to learn optimal parameter combinations and market environment classifications from historical data, achieving adaptive optimization of strategy parameters and intelligent identification of market states.
-
Partial Profit-Taking Mechanism: Introduce a phased exit mechanism, partially closing positions when specific profit targets are reached, both protecting existing profits and not missing potential major trends.
These optimization directions can not only enhance the strategy's adaptability and robustness in different market environments but also better balance risk and return, improving long-term profitability. In particular, dynamic parameter adjustment and multi-timeframe confirmation can directly address the main deficiencies of the current strategy in parameter sensitivity and false signal issues.
Summary
The Parabolic SAR with Early Trend Detection and MA Integrated Exit Strategy is an elegantly designed quantitative trading system that achieves a balance between early trend capture and intelligent exits by combining the trend identification capabilities of the SAR indicator with the smoothing effect of the MA indicator. The core innovation of the strategy lies in its integrated exit mechanism, which effectively reduces the false signal problems that may arise from relying on a single indicator.
The strategy demonstrates professional technical indicator calculation methods and a clear logical architecture in its code implementation, enhancing the identifiability of trading signals through carefully designed visualization elements. Although there are risks such as parameter sensitivity and underperformance in range-bound markets, these issues can be effectively mitigated through the suggested optimization directions, especially dynamic parameter adjustment and multidimensional signal confirmation.
Overall, this is a trend-following strategy with practical value, suitable for traders seeking to balance early entry opportunities while avoiding premature exits. With reasonable parameter optimization and risk management, this strategy has the potential to achieve stable risk-adjusted returns in various market environments.
- 1