
Overview
The Triple Hull Moving Average Trend Following Quantitative Strategy is an efficient trend-following trading system based on the Hull moving average series. This strategy utilizes three different types of Hull moving average variants (HMA, EHMA, and THMA) to identify and capture market trends. The core logic lies in observing the relationship between the current Hull average value and its value from two periods ago - entering long positions when the average breaks above its value from two periods ago, and short positions when it breaks below. The strategy employs a fixed risk control of 1% of account equity and does not set stop-loss or take-profit levels, relying instead on trend reversal signals for natural exits, maximizing position holding time during strong trends.
Strategy Principles
The core principles of this strategy revolve around three Hull moving average variants:
- HMA (Hull Moving Average): Calculated using Weighted Moving Average (WMA), it offers the highest reactivity and minimal lag, suitable for rapidly changing markets.
- EHMA (Exponential Hull Moving Average): Uses Exponential Moving Average (EMA) instead of WMA for calculation, providing smoother curves while maintaining responsiveness, effectively filtering market noise.
- THMA (Triple Hull Moving Average): Uses a more complex combination of WMAs for calculation, providing three-layer smoothing effects, suitable for confirming stronger trend signals.
The strategy confirms trend direction by comparing the current Hull average value with its value from two periods ago: when the current value is greater than the value from two periods ago, it's identified as an uptrend; when smaller, it's identified as a downtrend. This comparison method is superior to traditional price-average crossovers, more effectively filtering false breakouts and only entering when structural trend changes are confirmed.
The trading logic is clear: when an uptrend is confirmed, all short positions are closed and long positions are opened; when a downtrend is confirmed, all long positions are closed and short positions are opened. Each trade risks a fixed 1% of account equity with no stop-loss or take-profit levels set, using trend reversal signals for natural position closing.
Strategy Advantages
-
Multi-dimensional Trend Confirmation: Through three Hull average variants with different characteristics, traders can choose the most suitable calculation method based on market characteristics and trading timeframes, enhancing strategy adaptability.
-
Structural Trend Identification: Unlike simple price-average crossovers, this strategy confirms trends through dynamic changes in the average itself, effectively identifying true structural trend changes and reducing false signal risks.
-
Visual Clarity: The strategy uses color coding (green for uptrends, red for downtrends) to intuitively display trend status, with optional color marking of candlesticks, providing immediate market interpretation.
-
Disciplined Capital Management: The fixed 1% risk allocation reflects a sound capital management philosophy, avoiding risks from excessive leverage.
-
Trend Continuity Capture: By not setting fixed stop-loss or take-profit levels, the strategy can maximize capture of long-term trend movements, avoiding opportunity cost losses from premature exits.
-
Psychological Advantage: The simplified decision mechanism and clear entry/exit rules reduce emotional interference during trading, supporting the development of a disciplined trading mindset.
Strategy Risks
-
Drawdown Risk: Due to the absence of stop-losses, the strategy may face significant drawdowns during severe market reversals until a trend reversal signal appears. To mitigate this risk, consider adding a distant dynamic stop-loss mechanism without affecting the strategy's core logic.
-
Parameter Sensitivity: The choice of Hull average length parameter (default 55) significantly impacts strategy performance. Shorter lengths may lead to overtrading, while longer ones might miss important trend starting points. It's recommended to calibrate optimal parameters for different market conditions through historical backtesting.
-
False Breakout Risk: Although the strategy reduces false signals through its two-period comparison mechanism, unnecessary trades may still occur due to short-term false breakouts in sideways consolidations or highly volatile markets. This can be further optimized by adding additional filtering conditions (such as volatility filters).
-
Market Adaptability Limitations: The strategy performs excellently in strong trending markets but may underperform in range-bound or directionless markets. Traders should flexibly adjust whether to enable this strategy based on market environments.
Strategy Optimization Directions
-
Adaptive Parameter Adjustment: Introduce volatility indicators (such as ATR) to dynamically adjust the Hull average length parameter, using longer periods in high-volatility environments and shorter periods in low-volatility environments, improving the strategy's adaptive capabilities.
-
Multi-timeframe Confirmation: Introduce higher timeframe trend confirmation mechanisms, only opening positions when trends across different timeframes align, effectively reducing false breakouts and unnecessary trading frequency.
-
Dynamic Risk Management: The current strategy uses a fixed 1% account risk; consider dynamically adjusting risk percentages based on market volatility and trend strength, appropriately increasing positions in strong trends and reducing positions in weak trends.
-
Multi-factor Integration: Combine other technical indicators (such as RSI, MACD, or Bollinger Bands) as auxiliary confirmation signals to establish a multi-factor trend confirmation system, improving signal quality.
-
Partial Profit Locking Mechanism: While maintaining the core philosophy of not setting fixed take-profit levels, introduce partial profit locking mechanisms. For example, move a portion of the position after achieving certain profits while keeping another portion to continue tracking the trend, balancing risk and reward.
Summary
The Triple Hull Moving Average Trend Following Quantitative Strategy represents a mature and refined trend-following trading philosophy. By flexibly selecting Hull average variants, adopting structural trend confirmation methods, implementing strict risk control, and trusting the natural evolution of trends, this strategy provides a concise and effective framework for traders pursuing long-term market trends. It is particularly suitable for disciplined traders who have the patience to let trends fully develop and the discipline to selectively deploy capital.
While the strategy sacrifices some flexibility by not setting fixed stop-loss or take-profit levels, it successfully balances risk control and trend capture by using average reversal signals as natural exit mechanisms. Through the optimization directions proposed earlier, this strategy has potential for further performance improvement, especially in market adaptability and risk management. For quantitative traders seeking robust, systematic trend-following methods, this represents a strategy framework worthy of in-depth research and practice.
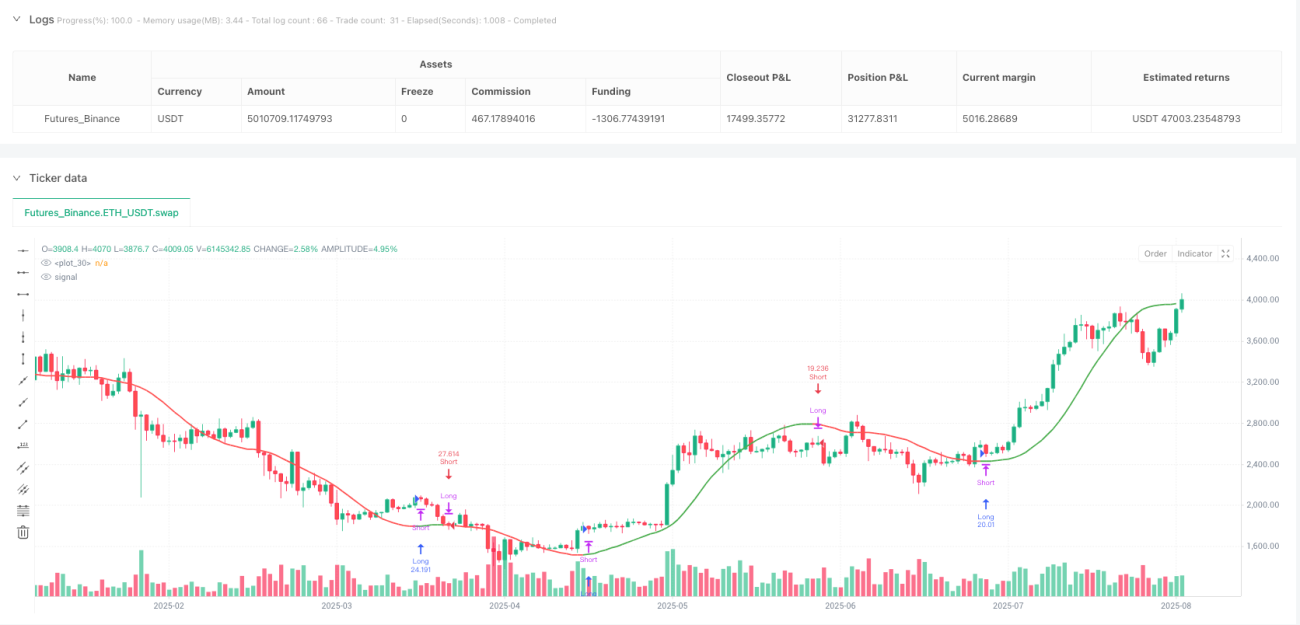
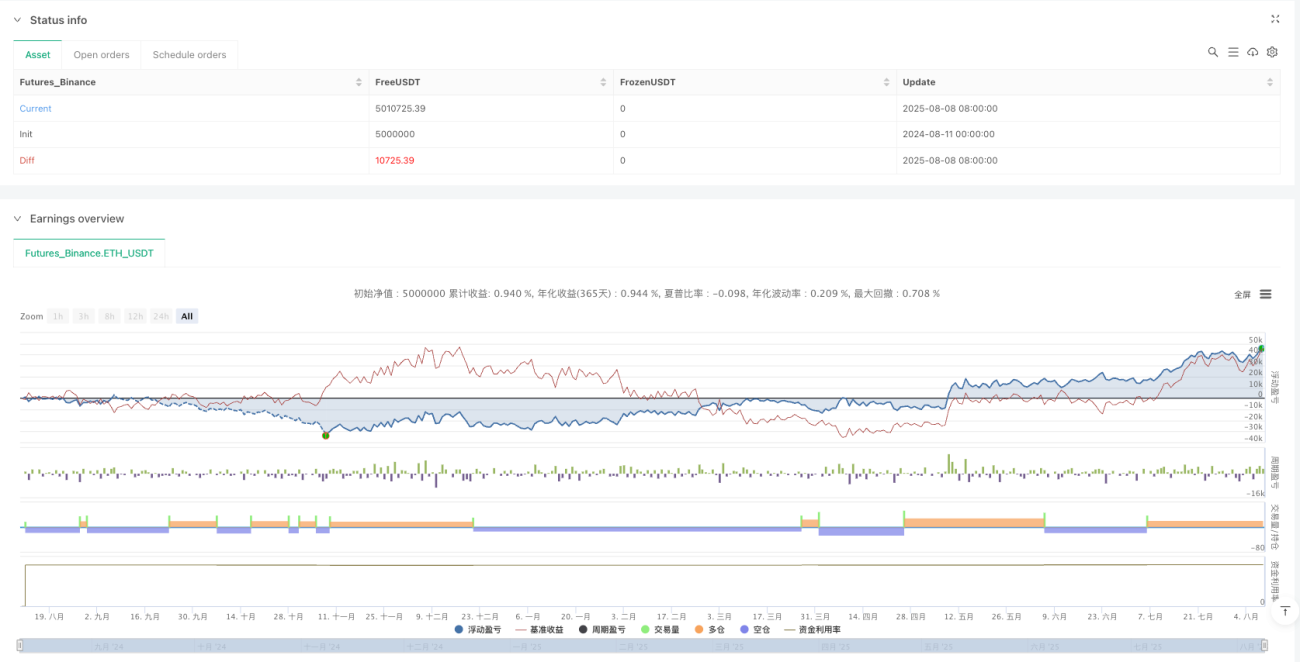
/*backtest
start: 2024-08-11 00:00:00
end: 2025-08-09 08:00:00
period: 1d
basePeriod: 1d
exchanges: [{"eid":"Futures_Binance","currency":"ETH_USDT","balance":5000000}]
*/

//@version=6
strategy("Hull Suite Strategy – 1% Risk, No SL/TP (v6)", overlay=true, pyramiding=1,
     default_qty_type=strategy.percent_of_equity, default_qty_value=1)
- 1