
Overview
The Multi-Indicator Trend Momentum Trading Strategy is a comprehensive quantitative trading system that cleverly combines the Relative Strength Index (RSI), Bollinger Bands, and Moving Average Convergence Divergence (MACD) to identify market trends and generate precise trading signals. Initially optimized for the 15-minute timeframe, this strategy's design principles and parameter settings make it adaptable to various time periods, offering traders flexible application scenarios. By analyzing market conditions through multiple dimensions, the strategy can capture price reversals in overbought and oversold regions while confirming trend momentum direction, thereby improving the accuracy of trading decisions and profitability.
Strategy Principles
The core principle of this strategy is the collaborative effect of three key technical indicators to confirm trading signals:
-
Relative Strength Index (RSI): Used to identify overbought and oversold market conditions. The strategy sets RSI below 45 as approaching oversold territory, indicating potential upward opportunities; when RSI exceeds 55, the market is considered approaching overbought territory, suggesting potential downside risk.
-
Bollinger Bands: Serve as dynamic support and resistance levels, helping to determine precise entry and exit zones. Price approaching or breaking below the lower band is viewed as a potential buy signal, while price approaching or breaking above the upper band is considered a potential sell signal.
-
MACD Indicator: Detects momentum changes through moving average crossovers. A bullish crossover occurs when the MACD line crosses above the signal line, while a bearish crossover happens when the MACD line crosses below the signal line.
Buy signal trigger conditions:
- RSI below 45 (indicating oversold market conditions)
- Price near or below the lower Bollinger Band (price < lower band × 1.02)
- MACD bullish crossover (MACD line crosses above the signal line)
Sell signal trigger conditions:
- RSI above 55 (indicating overbought market conditions)
- Price near or above the upper Bollinger Band (price > upper band × 0.98)
- MACD bearish crossover (MACD line crosses below the signal line)
Additionally, the strategy implements trade timing control by setting a minimum interval between trades (default 15 bars), preventing frequent trading in oscillating markets and effectively reducing losses from false signals.
Strategy Advantages
-
Multi-dimensional Signal Confirmation: By combining RSI, Bollinger Bands, and MACD—three different types of technical indicators—the strategy can verify trading signals from multiple angles, significantly reducing the occurrence of false signals. RSI provides an overbought/oversold perspective, Bollinger Bands offer price volatility ranges, and MACD confirms momentum, forming a comprehensive trading decision system.
-
Adaptive Market Conditions: Bollinger Bands as dynamic support and resistance levels automatically adjust according to market volatility, maintaining strategy effectiveness across different volatility environments. Whether in high or low volatility markets, the strategy automatically adapts to changing market conditions.
-
Pyramiding Position Feature: The strategy supports up to 3 consecutive trades in the same direction, allowing traders to scale into positions when strong signals appear, magnifying returns from successful trades. This feature is particularly effective when clear trends form, fully capturing profit opportunities from trends.
-
Prevention of Frequent Trading: By setting a minimum interval between trades, the strategy effectively avoids the high transaction costs and consecutive loss risks associated with frequent trading in oscillating markets. This mechanism helps reduce the interference of market noise on trading decisions.
-
Visualized Trading Signals: The strategy marks buy and sell signals on the chart and draws key RSI level lines, allowing traders to intuitively understand and verify trading logic, facilitating strategy monitoring and execution.
Strategy Risks
-
False Signal Risk: Despite using multi-indicator confirmation, false signals may still occur in violently volatile or range-bound markets, leading to unnecessary trading losses. Especially when all three indicators simultaneously meet conditions in a short period but quickly reverse afterward, traders may face unfavorable market movements.
-
Parameter Optimization Risk: The strategy's effectiveness heavily depends on parameter settings for RSI, Bollinger Bands, and MACD. Different market environments may require different parameter combinations, and excessive optimization might cause significant discrepancies between live trading performance and backtesting results, creating curve-fitting risk.
-
Liquidity Risk: In markets or time periods with low trading volume, issues like slippage and execution difficulties may arise, especially when executing large trades, making this risk more significant.
-
Trend Change Recognition Delay: Since the strategy uses lagging indicators like MACD, there may be signal delays when market trends suddenly change, leading to less-than-ideal entry or exit timing, missing optimal trading opportunities or increasing potential losses.
-
Fixed Trade Size Risk: The strategy uses a fixed trade quantity (user-defined) rather than dynamically adjusting based on account size or risk management principles, potentially causing unbalanced risk exposure—excessive risk or insufficient risk in certain situations.
Solutions:
- Add additional filtering conditions, such as combining longer-period trend confirmation or market volatility indicators to reduce false signals.
- Regularly re-optimize parameters or use adaptive parameter adjustment mechanisms to adapt to different market environments.
- Implement strict risk management, including setting stop-losses and adjusting trade sizes based on account size and market volatility.
- Consider adding trend strength filters to reduce trading frequency in weak trend or range-bound markets.
Strategy Optimization Directions
-
Dynamic Parameter Adjustment: Set RSI, Bollinger Bands, and MACD parameters to adaptive mode, dynamically adjusting based on market volatility and trend strength. For example, increase the Bollinger Bands multiplier in high-volatility markets or reduce RSI overbought/oversold thresholds in low-volatility markets. This allows the strategy to better adapt to different market environments and improve signal accuracy.
-
Risk Management Optimization: Introduce dynamic position management based on account size and market volatility, replacing the current fixed trade size setting. Implement position sizing calculations based on ATR (Average True Range), ensuring consistent risk exposure for each trade and protecting account capital safety.
-
Trend Strength Filtering: Add trend strength indicators like ADX (Average Directional Index), executing trades only when trends are sufficiently strong. This can reduce error signals in oscillating markets, improving trade success rates and overall profitability.
-
Multi-timeframe Analysis: Integrate longer timeframe trend analysis, executing trades only when the longer period trend direction aligns with the current signal. This "top-down" analysis approach can improve signal reliability and avoid trading against major trends.
-
Machine Learning Optimization: Utilize machine learning algorithms to analyze historical data, identify optimal parameter combinations and trading conditions, and dynamically adjust based on the latest market data. This can transcend traditional fixed-rule trading systems, achieving more intelligent decision-making processes.
-
Diversify Exit Strategies: The current strategy mainly relies on reverse signals for exits. Adding partial profit-taking strategies based on risk-reward ratios, trailing stops, and time-based exits can create more diverse exit mechanisms to adapt to different market situations and optimize the overall return structure.
Implementing these optimization directions will make the strategy more refined and robust, better equipped to handle various market conditions, and improve long-term profitability and capital curve stability.
Summary
The Multi-Indicator Trend Momentum Trading Strategy integrates RSI, Bollinger Bands, and MACD—three powerful technical indicators—to construct a comprehensive and balanced trading system. This strategy effectively identifies market overbought and oversold conditions, captures price relationships with volatility bands, and enhances signal reliability through momentum confirmation. The design thoroughly considers trading timing, signal confirmation, and execution logic, providing traders with clear entry and exit conditions.
Despite some potential risks such as parameter sensitivity and market environment adaptability challenges, these risks can be effectively controlled and mitigated through the proposed optimization directions, especially dynamic parameter adjustment, enhanced risk management, and multi-timeframe analysis. The strategy's pyramiding position feature and minimum trade interval setting further enhance its practicality and robustness in actual trading.
Overall, this is a well-designed, logically clear quantitative trading strategy with practical value. For traders seeking to capture trend momentum opportunities in the market, this strategy provides a reliable framework that can manage trading decisions through a systematic approach, reduce emotional interference, and improve long-term profitability.
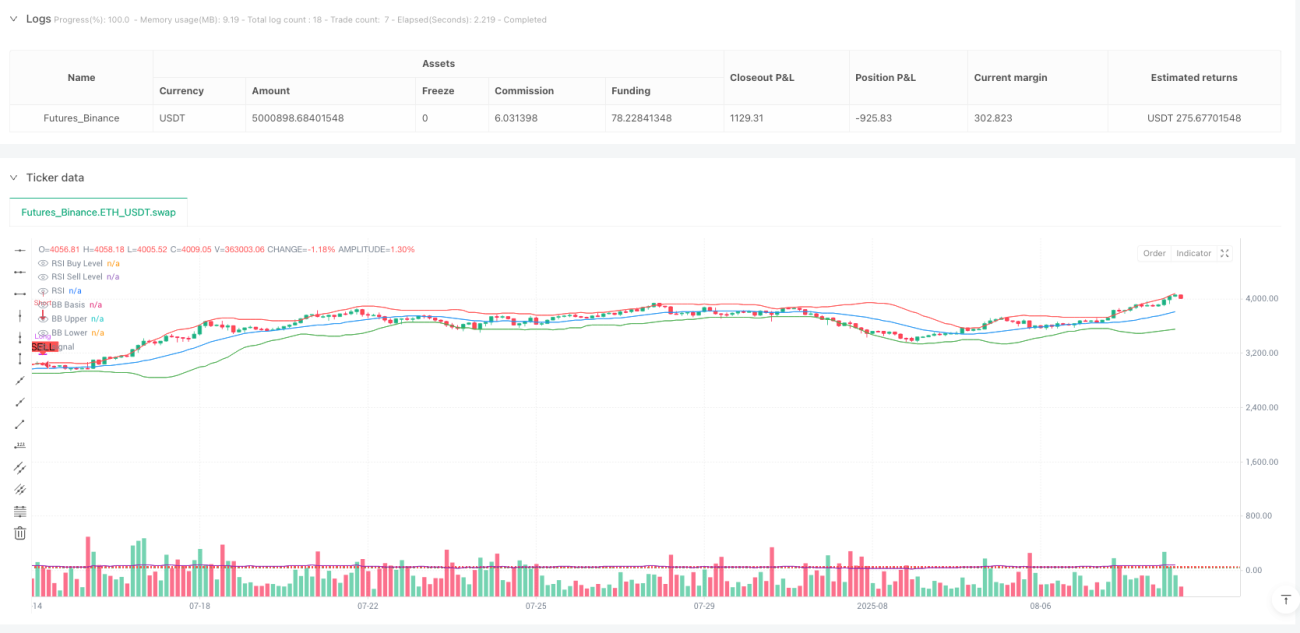
/*backtest
start: 2024-08-11 00:00:00
end: 2025-08-09 08:00:00
period: 3h
basePeriod: 3h
exchanges: [{"eid":"Futures_Binance","currency":"ETH_USDT","balance":5000000}]
*/

//@version=5
strategy("[ETH] Optimized Trend Strategy", shorttitle="Lorenzo-SuperScalping", overlay=true, pyramiding=3, initial_capital=100000, currency=currency.USD)

// === Input Parameters === //- 1