Dual Reversal Candlestick Pattern Quantitative Trading Strategy: Hammer and Shooting Star Recognition and Execution System

Overview
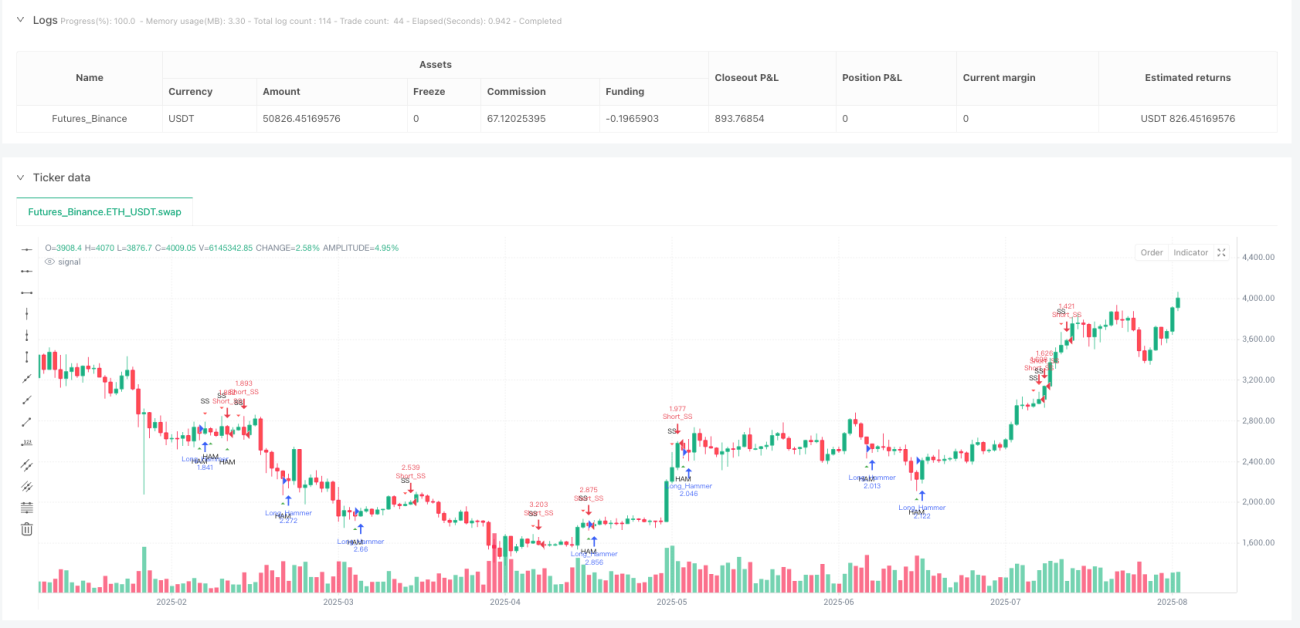
This strategy is a quantitative trading system based on classic candlestick pattern recognition, focusing on identifying two important reversal signals in the market: Hammer patterns and Shooting Star patterns. The Hammer pattern typically appears at the end of a downtrend and is viewed as a potential bullish reversal signal, while the Shooting Star pattern often appears at the top of an uptrend and is considered a potential bearish reversal signal. The strategy employs precise mathematical parameters to define these patterns, ensuring the accuracy and consistency of signals. When the system identifies a Hammer pattern, it executes a long position at the opening of the next candle; when it identifies a Shooting Star pattern, it executes a short position at the opening of the next candle. The strategy also sets stop-loss and take-profit levels based on pattern characteristics, providing a complete entry and exit mechanism.
Strategy Principles
The core principles of this strategy are based on precise mathematical definitions and identification of specific candlestick patterns:
-
Hammer Pattern Identification:
- Must be a bearish candle (open price higher than close price)
- Lower wick length must be at least 90% of the body length (controlled by wickFactor parameter)
- Upper wick length must not exceed 45% of the body length (controlled by maxOppositeWickFactor parameter)
- Candle body must represent at least 20% of the total candle range (controlled by minBodyRangePct parameter)
- When these conditions are met, the system identifies a Hammer pattern
-
Shooting Star Pattern Identification:
- Must be a bullish candle (open price lower than close price)
- Upper wick length must be at least 90% of the body length
- Lower wick length must not exceed 45% of the body length
- Candle body must represent at least 20% of the total candle range
- When these conditions are met, the system identifies a Shooting Star pattern
-
Trade Execution Logic:
- After a Hammer pattern appears, go long at the opening of the next candle
- After a Shooting Star pattern appears, go short at the opening of the next candle
- Stop-loss is set at the lowest point of the signal candle (Hammer pattern) or the highest point (Shooting Star pattern)
- Target price is set at the highest point of the signal candle (Hammer pattern) or the lowest point (Shooting Star pattern)
The strategy execution is based on the candle following the signal's appearance, which avoids look-ahead bias in backtesting and ensures the strategy's executability in actual trading.
Strategy Advantages
-
Clear Entry Signals: The strategy is based on clearly defined candlestick patterns, providing clear entry signals and reducing subjective judgment factors.
-
Comprehensive Risk Management: Each trade has clearly defined stop-loss and target prices, limiting the maximum loss per trade and contributing to long-term capital preservation.
-
Strong Parameter Adjustability: The strategy provides several key parameters (such as wick ratio, minimum body ratio, etc.) that can be optimized and adjusted for different markets and timeframes.
-
Adaptation to Market Reversals: Hammer and Shooting Star patterns are visual representations of changing market sentiment, capable of capturing potential turning points in market momentum.
-
Logically Placed Stop-Loss Points: The strategy's stop-loss is set at the extreme point of the pattern candle, which typically represents the market's last attempt in that direction; if breached, the reversal signal may be invalidated.
-
Suitable for Intraday Trading: The strategy's entries and exits are relatively quick, making it suitable for intraday traders to effectively utilize short-term market fluctuations.
Strategy Risks
-
False Breakout Risk: The market may produce patterns that meet the criteria but subsequently fail to reverse as expected, leading to trades hitting stop-loss.
-
Parameter Sensitivity: Strategy performance is very sensitive to parameter settings (such as wickFactor and minBodyRangePct); improper parameter settings may result in too many false signals or missed important signals.
-
Limited Applicability: The strategy may not perform well in oscillating markets or markets without clear trends, potentially resulting in consecutive losing trades.
-
Lack of Trend Confirmation: The strategy is based solely on single-candle patterns without considering the broader market trend context, potentially leading to counter-trend trading.
-
Conservative Take-Profit Levels: The strategy's take-profit is set at the extreme point of the signal candle, which may be too conservative and fail to fully capitalize on genuine reversal trends.
-
Capital Management Risk: The strategy uses a fixed proportion of capital (10% of equity) for trading, which could lead to significant account drawdowns in the case of consecutive losses.
Strategy Optimization Directions
-
Add Trend Filters: Combine moving averages or other trend indicators to execute trades only in the direction of the trend, for example, only looking for Hammer patterns to go long in downtrends and Shooting Star patterns to go short in uptrends.
-
Add Volume Confirmation: Require signal candles to be accompanied by higher volume, enhancing the reliability of the pattern, as reversals typically come with increased trading activity.
-
Optimize Take-Profit Mechanism: Introduce dynamic take-profit strategies, such as trailing stops or ATR (Average True Range) based take-profit levels, to capture more profit in strong reversals.
-
Incorporate Multi-Timeframe Analysis: Confirm market trend direction on larger timeframes and only execute reversal signals that align with the major trend.
-
Implement Signal Strength Scoring: Score signals based on the perfection of the pattern (such as wick ratio, candle position, previous price action, etc.) and only execute high-scoring signals.
-
Add Market Environment Filters: Adjust parameters or pause trading in high-volatility environments to avoid false signals when market noise is high.
-
Integrate Other Technical Indicators: Combine with divergence signals from RSI, MACD, or other indicators, executing trades only when multiple indicators confirm together.
Summary
The Dual Reversal Candlestick Pattern Quantitative Trading Strategy is an automated trading system based on classic technical analysis, capturing potential market reversal opportunities through precise definition and identification of Hammer and Shooting Star candlestick patterns. The strategy features clear entry signals and comprehensive risk management mechanisms, making it suitable for intraday traders. However, as a system purely based on pattern recognition, it also faces risks such as false breakouts and lack of trend confirmation.
The strategy's greatest advantage lies in its simplicity and clarity, allowing traders to clearly understand the logic behind each trade. To improve the strategy's robustness, it is recommended to add trend filters, volume confirmation, and optimize the take-profit mechanism. Through these optimizations, false signals can be reduced, and the strategy's overall profitability and risk-reward ratio can be improved.
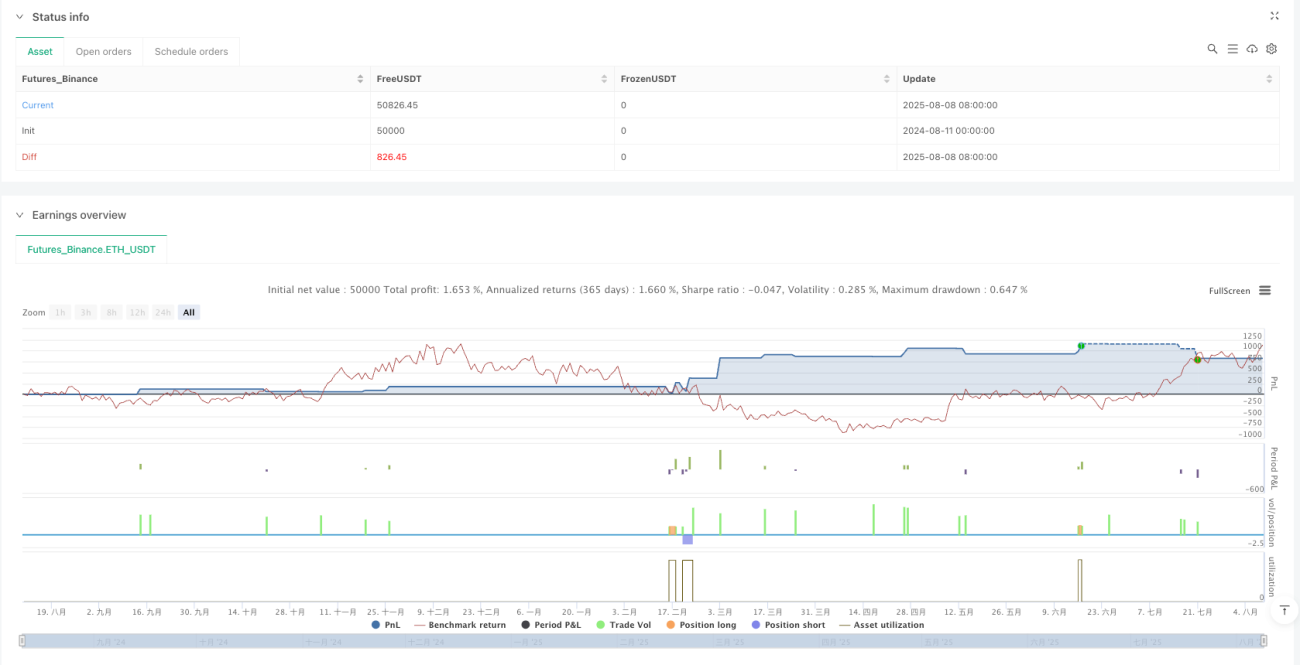
Ultimately, like all trading strategies, traders should conduct thorough backtesting and forward testing before actual application, and adjust parameters based on specific market conditions and personal risk preferences. This strategy can serve as a basic framework that, through continuous optimization and personalization, can develop into an effective tool suited to individual trading styles.
/*backtest
start: 2024-08-11 00:00:00
end: 2025-08-09 08:00:00
period: 1d
basePeriod: 1d
exchanges: [{"eid":"Futures_Binance","currency":"ETH_USDT"}]
*/

//@version=5
strategy("Hammer & Shooting Star — Strategy", overlay=true, pyramiding=0,
     default_qty_type=strategy.percent_of_equity, default_qty_value=10, initial_capital=10000, calc_on_every_tick=true)
- 1