
Overview
The Multi-Timeframe Quadruple-Factor Trend-Momentum Trading System is a comprehensive quantitative trading strategy that combines trend confirmation, price momentum, and multi-timeframe analysis. This strategy integrates the Hull Moving Average (HMA), Ichimoku Cloud, daily candle comparison, and a Hull-based MACD indicator to identify high-probability market entry points through multiple confirmation mechanisms. It aims to capture sustained trend movements while effectively filtering out false signals.
Strategy Principles
The core principle of this strategy is the coordinated action of four key components to confirm trading direction:
-
Hull Moving Average Crossover: Calculates the Hull Moving Average for the current period and the previous period. When the current HMA is greater than the previous HMA, it's considered a bullish signal; otherwise, it's bearish. The Hull Moving Average responds faster to price changes while maintaining smoothness, effectively reducing the lag commonly found in traditional moving averages.
-
Daily Candle Comparison: Through cross-timeframe analysis, compares the current daily price with the previous day's price. When today's price is higher than yesterday's, it confirms upward momentum; otherwise, it confirms downward momentum. This component provides market direction confirmation from a higher timeframe.
-
Ichimoku Cloud Trend Confirmation: Uses the relative position of Senkou Span A and Senkou Span B from the Ichimoku Kinko Hyo to confirm market trends. When Senkou Span A is above Span B, it confirms a bullish trend; otherwise, it confirms a bearish trend.
-
Hull-Based MACD Momentum Indicator: Uses two Hull Moving Averages of different periods to calculate the MACD line, with another Hull Moving Average as the signal line. When the MACD line is above the signal line, it indicates upward momentum; otherwise, it indicates downward momentum.
Trading signals require all four conditions to be met simultaneously:
- Long entry conditions: Bullish HMA cross + Upward daily momentum + Price above previous HMA + Bullish Ichimoku Cloud + MACD above signal line
- Short entry conditions: The reverse combination of the above conditions
Strategy Advantages
-
Multiple Confirmation Mechanism: The strategy requires confirmation from four different technical indicators, significantly reducing the possibility of false signals and improving the reliability of trading signals.
-
Multi-Timeframe Integration: By incorporating daily level price dynamics, the strategy can confirm market direction at a higher level, avoiding erroneous judgments during short-term fluctuations.
-
Balance of Response Speed and Filtering: The Hull Moving Average has faster response and less lag compared to traditional moving averages while maintaining good smoothing effects, achieving a balance between signal timeliness and noise filtering.
-
Dual Verification of Trend and Momentum: Combining Ichimoku Cloud's trend confirmation with MACD's momentum confirmation verifies both the direction and strength of the market, improving the success rate of trades.
-
Strong Adaptability: All components of the strategy have adjustable parameters that can be optimized for different market environments and trading instruments, providing strong adaptability.
Strategy Risks
-
Parameter Sensitivity: The strategy involves multiple indicator parameter settings, such as Hull Moving Average periods and Ichimoku line calculation periods. Different parameter combinations can lead to vastly different trading results, risking overfitting to historical data.
-
Lag Risk: Although the Hull Moving Average has less lag than traditional moving averages, any strategy based on technical indicators cannot completely avoid signal lag issues, potentially leading to less-than-ideal entry points.
-
Poor Performance in Ranging Markets: The strategy is primarily designed for trending markets and may generate frequent false signals in sideways or highly volatile market environments, leading to consecutive losses.
-
Multiple Conditions Restrict Trading Frequency: The requirement for all four conditions to be met simultaneously may result in relatively rare trading signals, potentially missing profitable opportunities in certain market environments.
-
Data Dependency in Cross-Timeframe Analysis: Daily data requests require more historical data support, potentially increasing the computational resource requirements and backtesting complexity.
Risk mitigation methods:
- Optimize parameters for different market environments to find robust parameter combinations
- Consider adding stop-loss mechanisms to control single-trade risk
- Consider temporarily disabling the strategy or adding additional filtering conditions in sideways markets
- Incorporate volatility indicators to adjust strategy sensitivity in high-volatility environments
Strategy Optimization Directions
-
Dynamic Parameter Adjustment Mechanism: Consider automatically adjusting Hull Moving Average and MACD parameters based on market volatility, using longer periods in high-volatility environments to reduce noise and shorter periods in low-volatility environments to increase sensitivity.
-
Add Stop-Loss and Take-Profit Mechanisms: The current strategy primarily focuses on entry signals. Adding dynamic stop-loss and take-profit mechanisms based on ATR (Average True Range) or Ichimoku Cloud components would improve the risk management system.
-
Add Volume Confirmation: Consider using volume indicators as additional confirmation factors, executing trading signals only when supported by volume, which can improve the accuracy of trend judgment.
-
Optimize Multi-Timeframe Structure: In addition to daily and current periods, consider adding intermediate-level timeframe analysis to build a more complete multi-timeframe confirmation system, such as adding 4-hour or weekly level trend confirmation.
-
Machine Learning Optimization: Utilize machine learning algorithms to automatically find optimal parameter combinations or predict and adjust strategy performance in different market environments based on historical pattern recognition.
-
Add Filtering Conditions: Consider adding filtering conditions based on market structure (such as support/resistance levels) or volatility cycles to avoid generating trading signals in unfavorable market environments.
These optimization directions aim to improve the strategy's adaptability and stability in different market environments while maintaining the integrity and effectiveness of the core strategy logic.
Summary
The Multi-Timeframe Quadruple-Factor Trend-Momentum Trading System is a comprehensive quantitative strategy that pursues high-quality trading signals through the coordinated action of Hull Moving Average, daily price comparison, Ichimoku Cloud, and Hull-MACD. It confirms market trends and momentum at multiple levels, making it particularly suitable for medium to long-term trend-following trading. The multiple confirmation mechanism effectively filters out false signals, improving trading reliability.
Although the strategy faces certain challenges in parameter selection and market adaptability, with proper risk management and targeted optimization, its performance in different market environments can be further enhanced. In particular, improvements in dynamic parameter adjustment, stop-loss and take-profit mechanisms, and multi-timeframe structure optimization could help the strategy maintain high-quality signal characteristics while improving overall profitability stability and risk-adjusted returns.
The core value of this strategy lies in its strict requirements for trading signal quality. Through multi-level, multi-perspective market analysis, it provides a solid technical foundation for trading decisions, representing a refined quantitative trading method that pursues quality over quantity.
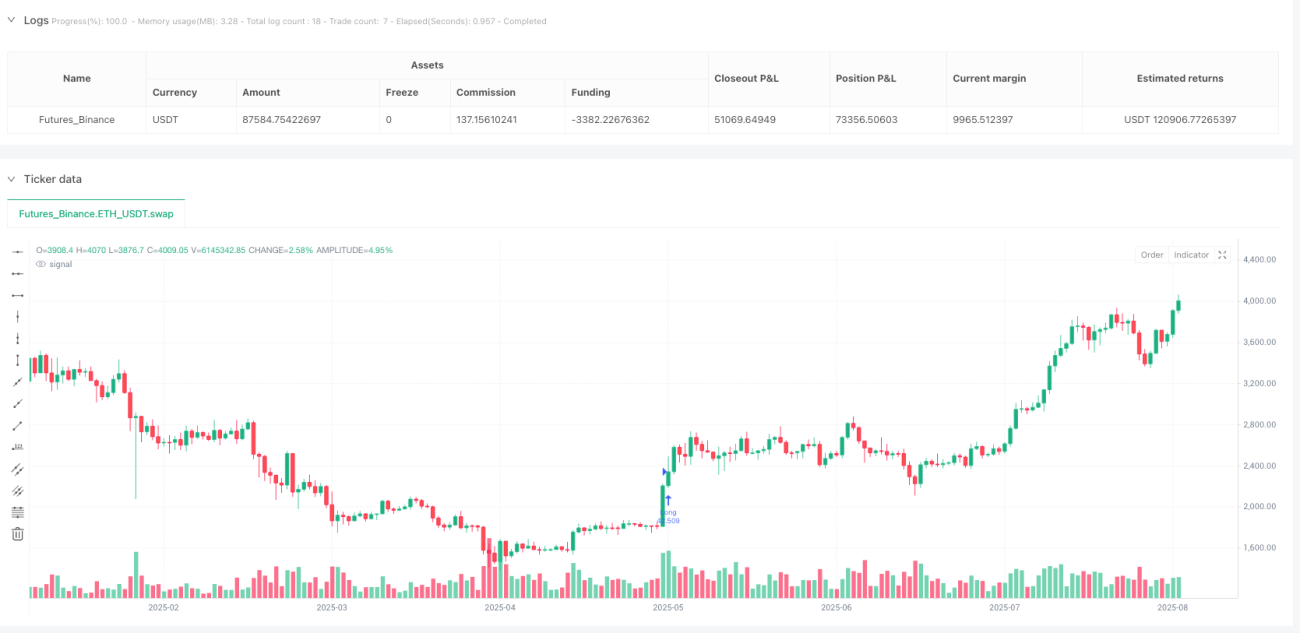
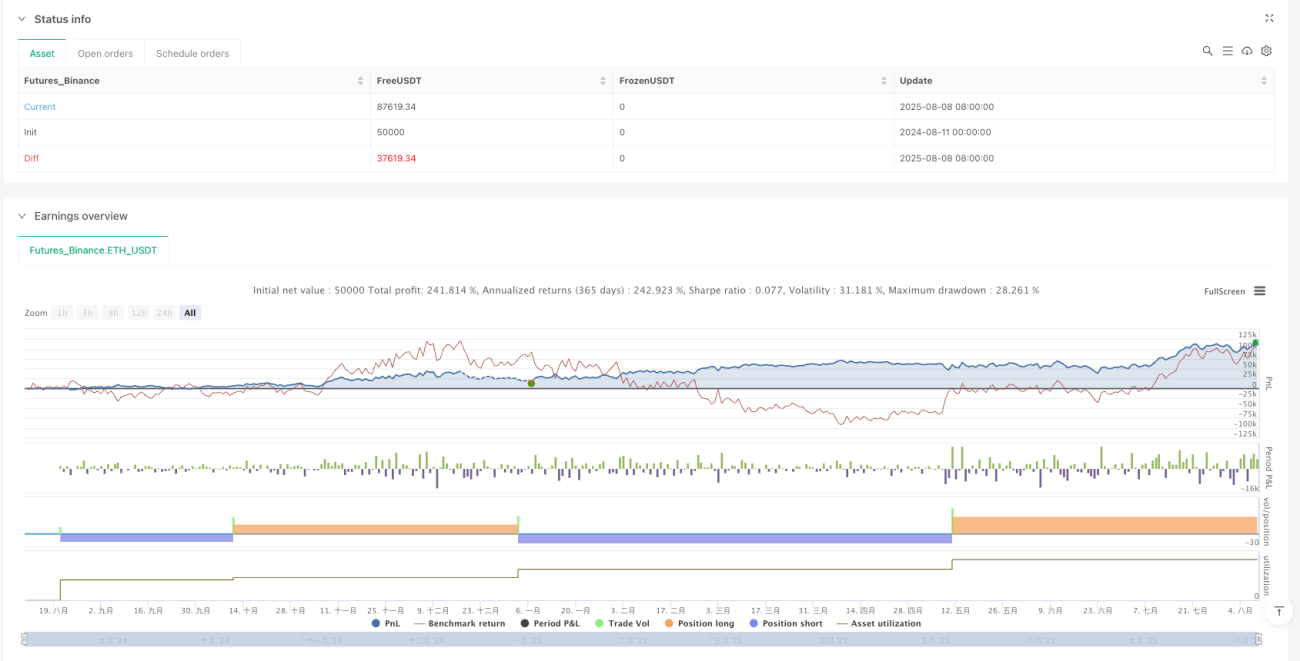
/*backtest
start: 2024-08-11 00:00:00
end: 2025-08-09 08:00:00
period: 1d
basePeriod: 1d
exchanges: [{"eid":"Futures_Binance","currency":"ETH_USDT"}]
*/

//@version=6
strategy("Ichimoku + Daily-Candle_X + HULL-MA_X + MacD (v6)", shorttitle="٩(̾●̮̮̃̾•̃̾)۶", overlay=true,
     initial_capital=10000, default_qty_type=strategy.percent_of_equity,
default_qty_value=100, commission_type=strategy.commission.percent,- 1