Multi-Timeframe Candlestick Pattern Breakout Dynamic Risk Management Quantitative Trading Strategy

Overview
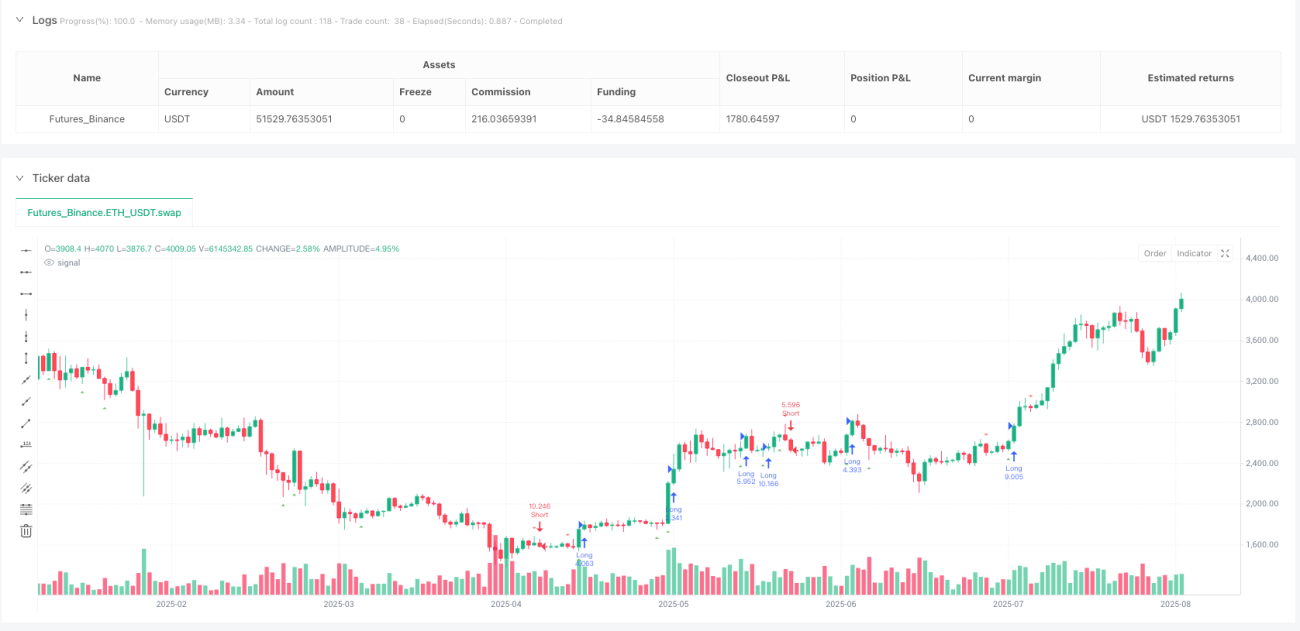
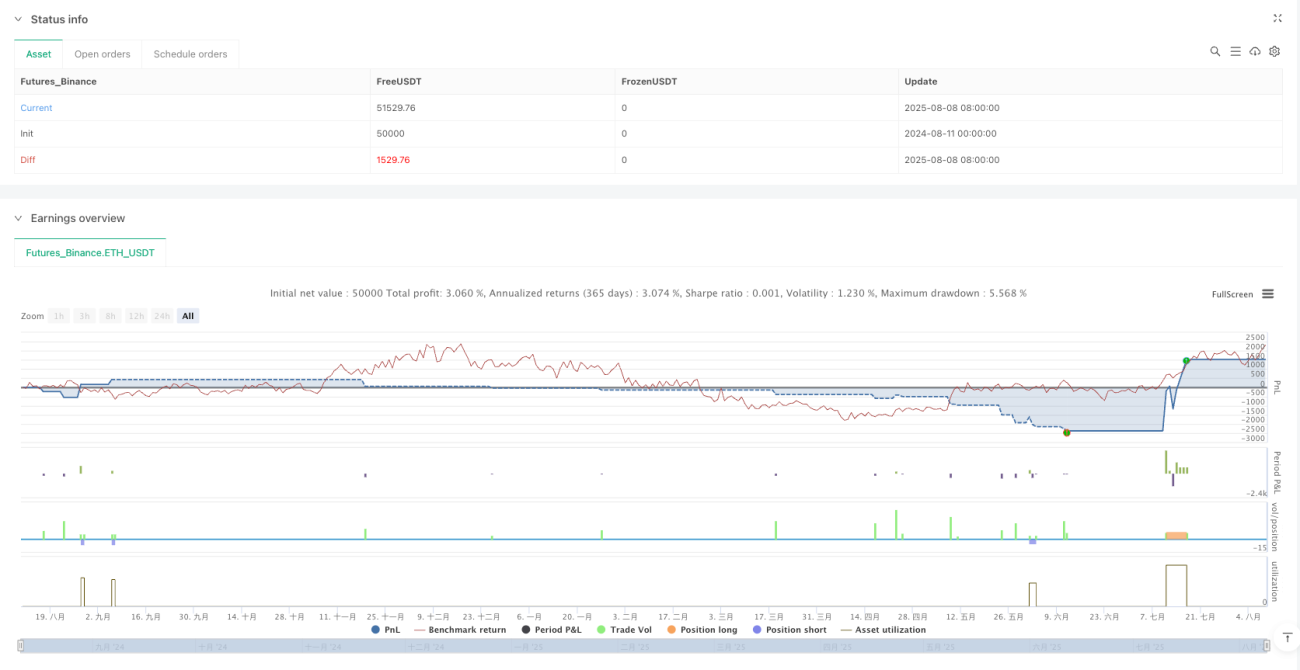
This strategy is an automated trading system that combines classic candlestick reversal pattern recognition with price breakout confirmation. The core of the strategy lies in capturing market sentiment turning points by identifying four high-probability reversal patterns (Hammer, Bullish Engulfing, Shooting Star, Bearish Engulfing) and entering positions when price breaks through key levels to achieve trend following. The system incorporates a comprehensive risk management mechanism using fixed percentage risk control and dynamic position sizing to ensure controllable risk for each trade. The strategy operates on the 1-hour timeframe, suitable for medium to short-term traders.
Strategy Principle
The strategy's operational logic consists of three core modules: signal identification, breakout confirmation, and risk management.
In the signal identification phase, the system determines whether specific patterns are formed by calculating candlestick body size and upper/lower wick lengths. For bullish signals, the Hammer pattern requires the lower wick to exceed twice the body size with the upper wick less than half the body; the Bullish Engulfing pattern requires the current candle to be bullish and completely engulf the previous bearish candle. For bearish signals, the Shooting Star requires the upper wick to exceed twice the body with a small lower wick; the Bearish Engulfing requires the current bearish candle to completely cover the previous bullish candle.
The breakout confirmation mechanism is a key innovation of the strategy. The system doesn't enter immediately when a pattern appears but waits for the next candle to break through the signal candle's high (for longs) or low (for shorts) before triggering a trade. This delayed confirmation mechanism effectively filters false signals and improves trading success rates.
The risk management module employs a fixed risk percentage model with each trade risking a fixed 2% of account equity. The system dynamically calculates position size based on the distance between entry and stop-loss prices, ensuring single trade losses remain within acceptable limits regardless of market volatility. Long trades use a 1:5 risk-reward ratio while short trades use 1:4, reflecting trend trading characteristics.
Strategy Advantages
First, pattern recognition accuracy is high. The four candlestick patterns selected by the strategy are classic reversal signals verified by long-term market testing, possessing high reliability. Strict mathematical definitions avoid subjective judgment, ensuring signal consistency and repeatability.
Second, the breakout confirmation mechanism significantly improves win rate. Traditional pattern trading strategies often enter immediately when patterns appear, easily falling into false breakout traps. This strategy effectively filters most noise signals by waiting for price breakout confirmation, entering only after the market truly chooses direction.
Third, the risk management system is comprehensive. The fixed percentage risk model ensures long-term account survival; even consecutive losses won't lead to account blowup. Dynamic position calculation keeps risk exposure consistent for each trade, avoiding emotional trading and excessive leverage.
Fourth, risk-reward ratio settings are reasonable. The 5:1 for longs and 4:1 for shorts profit-loss ratios fully consider market asymmetry, achieving positive expected returns even with only around 30% win rate. This setup is particularly suitable for capturing trending market characteristics.
Finally, strategy execution is fully automated, eliminating emotional influences from human intervention. All parameters are optimized and fixed; traders only need to set up the strategy to achieve a "set and forget" trading mode.
Strategy Risks
Despite the well-designed strategy, several potential risks require attention.
Market environment risk is the primary consideration. The strategy performs excellently in clearly trending markets but may generate frequent false breakout signals in ranging markets, leading to consecutive small losses. Consider adding market environment filters like ADX indicators to judge trend strength and reduce trading frequency during low volatility periods.
Slippage risk cannot be ignored in live trading. The nature of breakout trading means entries often accompany significant market volatility, with actual execution prices potentially deviating from expected prices. Consider using limit orders instead of market orders or incorporating reasonable slippage assumptions in backtesting.
Timeframe dependency is also a potential issue. The strategy is specifically optimized for 1-hour charts and may perform poorly on other timeframes. If trading on different timeframes is needed, consider re-optimizing parameters or developing adaptive mechanisms.
The psychological pressure of consecutive losses shouldn't be underestimated. While risk management mechanisms protect capital safety, consecutive losses may affect trader confidence. Consider setting maximum consecutive loss limits, pausing trading for strategy evaluation when reached.
Over-optimization risk needs vigilance. Current parameters may overfit historical data, with performance declining in future markets. Regular out-of-sample testing and parameter robustness analysis are recommended to ensure long-term strategy effectiveness.
Optimization Directions
Future optimization can proceed along multiple dimensions to further enhance strategy performance.
Multi-timeframe confirmation is an important improvement direction. Confirming trend direction on higher timeframes (like 4-hour or daily) and only trading when trend directions align can significantly improve win rate and reduce counter-trend trading risks.
Dynamic stop-loss mechanisms are worth exploring. The current strategy uses fixed stops; consider introducing trailing stops or ATR-based dynamic stops to protect profits while giving trades more room to develop. Particularly in strong trending markets, dynamic stops can capture larger profits.
Adding market state identification modules will greatly improve strategy adaptability. Judge current market state through volatility, volume, market structure indicators, using different parameter settings or trading rules in different states. For example, widening stop distances in high volatility markets and tightening entry conditions in low volatility markets.
Pattern recognition algorithms can be further optimized. Consider adding machine learning algorithms to train recognition of more complex pattern combinations through historical data. Or introduce fuzzy logic allowing pattern recognition some error tolerance to capture more trading opportunities.
Capital management strategy optimization has significant potential. Consider using Kelly formula for dynamic position adjustment or adjusting risk exposure based on recent strategy performance. Moderately increasing risk during consecutive profits and reducing risk during consecutive losses achieves smooth equity curve growth.
Summary
This strategy successfully combines classic technical analysis methods with modern quantitative trading concepts, creating a robust and reliable automated trading system. By capturing market turning points through candlestick pattern recognition, filtering false signals with breakout confirmation, and protecting capital safety with fixed risk management, the strategy demonstrates professional design philosophy at every level.
The strategy's core advantage lies in being simple yet sophisticated, with each component carefully designed and optimized. Mathematical definition of pattern recognition ensures signal objectivity, breakout confirmation mechanisms improve trading quality, and risk management systems guarantee long-term survival. The organic combination of these elements gives the strategy potential for stable profits in live trading.
Of course, no strategy is perfect. Traders need to fully understand its principles and limitations when using it, making appropriate adjustments based on their risk preferences and market experience. Sufficient backtesting and paper trading before live trading is recommended to ensure strategy effectiveness in current market environments.
Looking forward, with evolving market structures and technological advances, the strategy has significant room for improvement. Through continuous optimization and innovation, this strategy framework can adapt to changing market environments and create long-term stable returns for traders.
- 1