
Overview
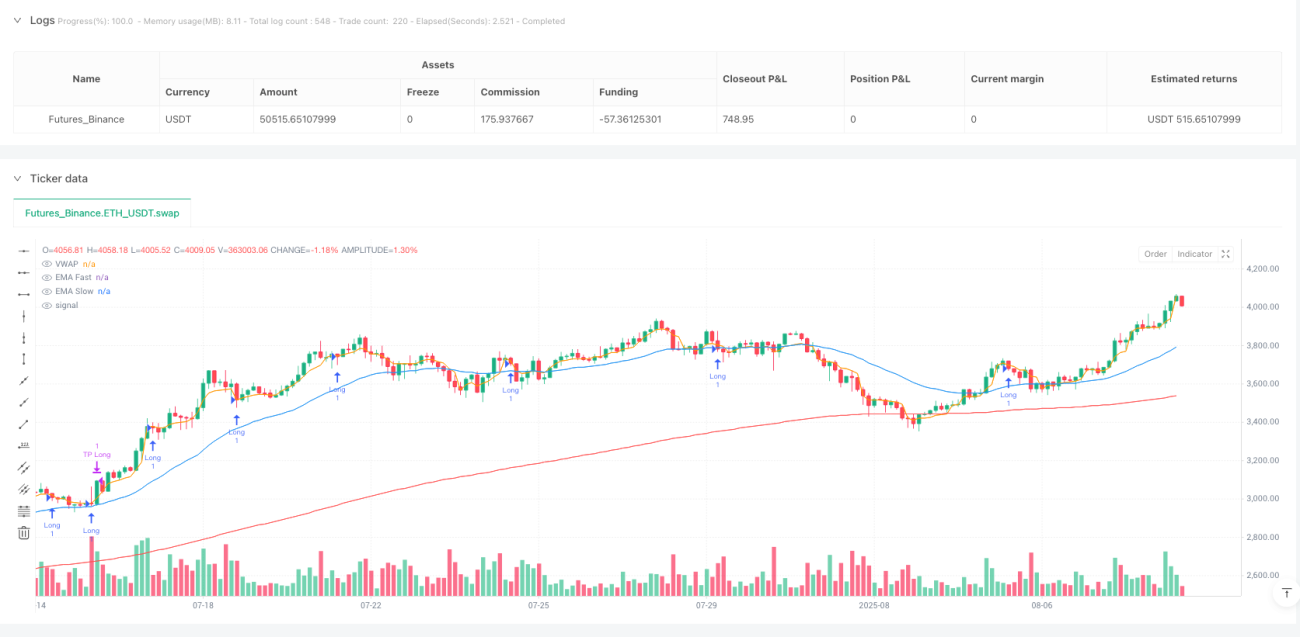
The Multi-Indicator Trend Momentum Capture Strategy is a quantitative trading system that integrates three major technical indicators: VWAP (Volume-Weighted Average Price), EMA (Exponential Moving Average), and ATR (Average True Range). The core concept of this strategy is to identify entry opportunities when price pulls back to "value zones" in strong trending markets while using dynamic ATR adjustments to adapt to changing market volatility. This strategy combines the advantages of trend following and pullback entries by using the EMA system to confirm trend direction and strength, while VWAP serves as a value reference line, providing high-probability entry points when price retraces to this zone during a trend.
Strategy Principles
The operating principles of this strategy can be divided into three core components:
-
EMA Trend Confirmation System:
- Uses 30-period EMA (fast line) and 200-period EMA (slow line) to identify market trends
- Confirms an uptrend when the fast line is above the slow line; confirms a downtrend when the fast line is below the slow line
-
ATR-Based Trend Strength Filter:
- Calculates the distance between fast and slow EMAs and compares it with ATR multiplied by a factor (default 1.5)
- Only confirms a trend as strong enough when the EMA distance exceeds the expanded ATR value, effectively filtering out noise in range-bound markets
-
VWAP Pullback Entry Mechanism:
- VWAP acts as a dynamic value zone reference line, representing the "fair value" of the day's trading
- Enters positions when price pulls back to VWAP during confirmed trends:
- Goes long when price drops below VWAP in an uptrend
- Goes short when price rises above VWAP in a downtrend
- Uses VWAP plus/minus ATR multiplier as profit targets
From the code implementation, the strategy first defines key parameters: fast EMA period (30), slow EMA period (200), ATR period (14), and ATR multiplier (1.5). It then calculates these indicators and sets trend filtering conditions to ensure trading only in strong trend environments. Finally, it determines entry signals based on the relationship between VWAP and price, and manages exits using ATR-based dynamic target prices.
Strategy Advantages
-
Multiple Confirmation Mechanism Improves Reliability:
- By integrating EMA trend direction, ATR strength filtering, and VWAP value zone triple confirmation, it significantly reduces the possibility of false signals
- Generates trading signals only when all conditions are met, ensuring high-quality entry points
-
Adaptive to Market Volatility:
- Uses ATR to dynamically adjust trend confirmation criteria and profit targets, allowing the strategy to automatically adapt to different market environments
- Sets looser parameters in high-volatility markets and stricter standards in low-volatility markets
-
Value-Based Entry Mechanism:
- VWAP serves as a "fair value" reference commonly used by institutional investors, providing psychologically and technically meaningful support/resistance zones
- Entering at value zones in the direction of the trend combines the advantages of trend following and reversal trading
-
Clear Risk Management Framework:
- Uses ATR-based dynamic profit targets that adjust expected returns based on actual market volatility
- Systematic entry and exit rules reduce subjective judgment and improve discipline
-
Adaptation to Professional Trading Environment:
- The strategy simulates institutional trader behavior patterns, i.e., trading in value zones when trends are confirmed
- VWAP as an institutional benchmark indicator enhances the strategy's synergy with large capital flows
Strategy Risks
-
Trend Reversal Risk:
- Despite using EMA and ATR filtering, the strategy may still be trapped when trends suddenly reverse
- Solution: Add additional trend confirmation indicators, such as RSI or MACD divergence signals, or implement stricter stop-loss mechanisms
-
Discontinuity Due to VWAP Reset:
- Since VWAP resets daily, it may produce price jumps at day boundaries, leading to inconsistent signals
- Solution: Consider using multi-timeframe VWAP or rolling VWAP to smooth this effect
-
Parameter Sensitivity:
- The choice of EMA periods and ATR multiplier significantly impacts strategy performance; inappropriate parameters may lead to overtrading or missed opportunities
- Solution: Optimize parameters through backtesting in different market environments, or consider adaptive parameter adjustment mechanisms
-
False Breakout/Pullback Risk:
- Price may briefly cross VWAP and quickly reverse, causing false signals
- Solution: Add confirmation filters, such as requiring price to maintain a certain time or distance after crossing VWAP before triggering signals
-
High-Frequency Trading Environment Limitations:
- In high-frequency trading environments, VWAP may be affected by market microstructure and algorithmic trading
- Solution: Use additional noise filters for high-frequency data or consider time-weighted VWAP
Strategy Optimization Directions
-
Multi-Timeframe Analysis Integration:
- Introduce higher timeframe trend confirmation mechanisms to ensure trading direction aligns with larger trends
- Implementation: Add daily or weekly EMAs as additional filtering conditions, trading only when trends across multiple timeframes are consistent
-
Dynamic ATR Multiplier Adjustment:
- Automatically adjust the ATR multiplier based on market volatility states, increasing sensitivity during low volatility periods and decreasing it during high volatility periods
- Implementation: The multiplier can be dynamically adjusted based on ATR historical percentiles or relative volatility indicators
-
Volume-Based Signal Weighting:
- Integrate volume analysis to enhance signal quality, assigning higher weights to breakouts/pullbacks in high-volume areas
- Implementation: Consider relative volume indicators or volume profile analysis as signal confirmation factors
-
Multi-Anchor VWAP System:
- Create value zone bands using VWAPs from multiple timeframes, rather than a single line
- Implementation: Can add weekly VWAP, monthly VWAP as additional references, or use VWAP standard deviation channels
-
Machine Learning Optimization:
- Use machine learning algorithms to dynamically adjust parameters or predict optimal entry points
- Implementation: Can use random forests or neural networks to predict success probabilities based on historical patterns, optimizing entry timing
-
Market Regime Adaptation:
- Automatically adjust strategy behavior based on whether the market is in a trending or range-bound state
- Implementation: Add trend strength indicators like ADX, use pullback entries in strong trends, avoid trading or switch to range strategies in weak trends
Summary
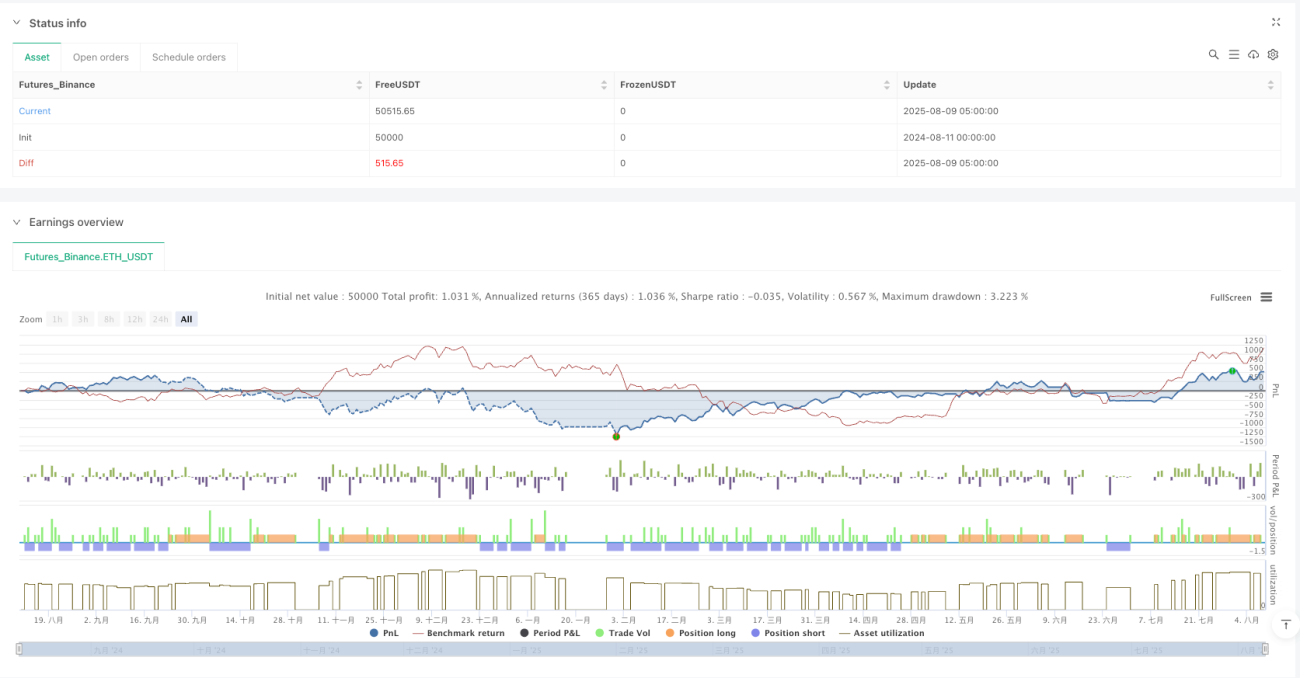
The Multi-Indicator Trend Momentum Capture Strategy creates a systematic framework for trend following and pullback entry by integrating VWAP, EMA, and ATR technical indicators. The core advantage of this strategy lies in the organic combination of trend direction judgment, trend strength filtering, and value zone entry, forming a multiple confirmation mechanism. By using ATR to dynamically adjust various parameters, the strategy demonstrates adaptability to different market environments.
Although there are risks such as trend reversals and parameter sensitivity, these issues can be effectively mitigated through appropriate risk management and strategy optimization. Future optimization directions include multi-timeframe analysis, dynamic parameter adjustment, volume analysis integration, etc., which will further enhance the strategy's robustness and adaptability.
Overall, this strategy embodies the core concepts of modern quantitative trading: systematic, multi-factor, adaptive, and disciplined, particularly suitable for traders seeking momentum opportunities in strong trending markets. By incorporating VWAP as a value reference commonly used by institutional traders, the strategy can capture high-probability pullback entry opportunities in trending environments, achieving more precise market timing.
- 1