
Overview
The Higher Timeframe EMA-Trend Heikin-Ashi Bollinger Band Mean-Reversion Strategy is a quantitative trading system that combines multiple technical indicators to capture mean-reversion opportunities while adhering to the overall trend direction of higher timeframes. The strategy primarily utilizes Heikin-Ashi candlestick techniques to smooth price action, Bollinger Bands to identify overbought and oversold areas, and higher timeframe Exponential Moving Average (EMA) crossovers to confirm the overall market trend. The core philosophy of this strategy is to "see the market before it moves," providing precise entry timing and strict risk management for a trading approach that both follows major trends and captures short-term price fluctuations.
Strategy Principles
The core principles of this strategy are based on the following key technical components:
-
Heikin-Ashi Calculation: Creates smoothed price action through a special calculation method ((open + high + low + close)/4) that reduces market noise and displays trend direction more clearly.
-
Bollinger Bands Application: Applies Bollinger Bands to Heikin-Ashi prices, creating dynamic support and resistance zones. The default parameters are 20 periods for length and 2 standard deviations, which can be adjusted based on market characteristics.
-
Higher Timeframe EMA Trend Confirmation: Uses higher timeframe (default 180 minutes) fast EMA (9-period) and slow EMA (21-period) crossovers to determine the overall market trend. When the fast EMA is above the slow EMA, an uptrend is confirmed; otherwise, a downtrend is confirmed.
-
Signal Generation Mechanism:
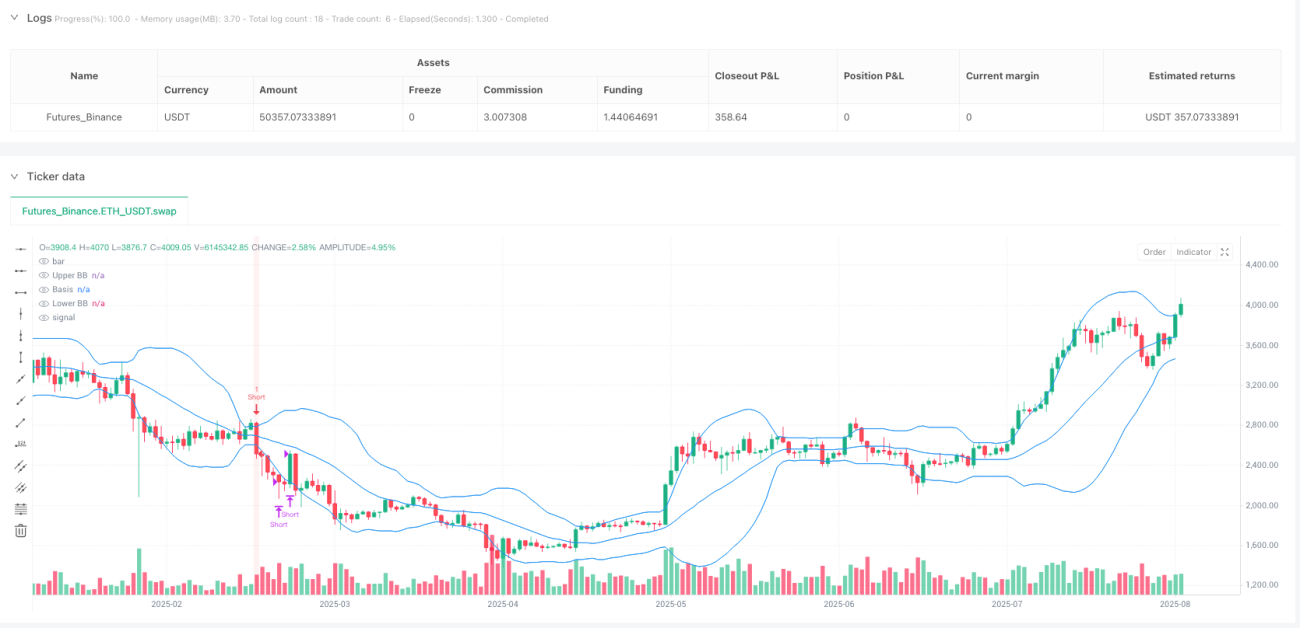
- Buy Signal: Triggered when the higher timeframe is in an uptrend (fast EMA > slow EMA), and after 2-3 consecutive red Heikin-Ashi candles touch or break below the lower Bollinger Band, followed by a green confirmation candle (close > open) with the close price returning inside the Bollinger Band.
- Sell Signal: Triggered when the higher timeframe is in a downtrend (fast EMA < slow EMA), and after 2-3 consecutive green Heikin-Ashi candles touch or break above the upper Bollinger Band, followed by a red confirmation candle (close < open) with the close price returning inside the Bollinger Band.
-
Risk Management Framework:
- Initial stop-loss set at the previous candle's low (for longs) or high (for shorts)
- First target price set at an equal risk-reward ratio (1:1)
- After reaching the first target, 50% of the position is closed and the stop-loss is moved to the entry price
- Subsequently, a trailing stop (based on the previous candle's low or high) protects the remaining position's profits
This strategy is essentially a "mean-reversion + trend-following" hybrid, seeking short-term price reversion opportunities while ensuring these trades align with the overall trend direction of higher timeframes, thereby increasing the probability of success.
Strategy Advantages
-
Multiple Confirmation Mechanism: The strategy combines multiple technical analysis tools (Heikin-Ashi candlesticks, Bollinger Bands, EMA crossovers) to form a strict multiple confirmation system, reducing false signals and improving entry precision.
-
Trend-Following Design: By confirming the overall market trend through higher timeframe EMA crossovers, it ensures all trades are in the direction of the main trend, avoiding the high risk of counter-trend trading.
-
Application of Mean-Reversion Principle: The strategy leverages the market's mean-reversion characteristics, seeking reversion opportunities after short-term price deviations (touching Bollinger Bands), which is a statistically proven effective trading concept.
-
Smoothing Price Noise: The Heikin-Ashi candlestick technique effectively reduces market noise, making trend directions and potential reversal points more clearly visible, reducing erroneous trades caused by market noise.
-
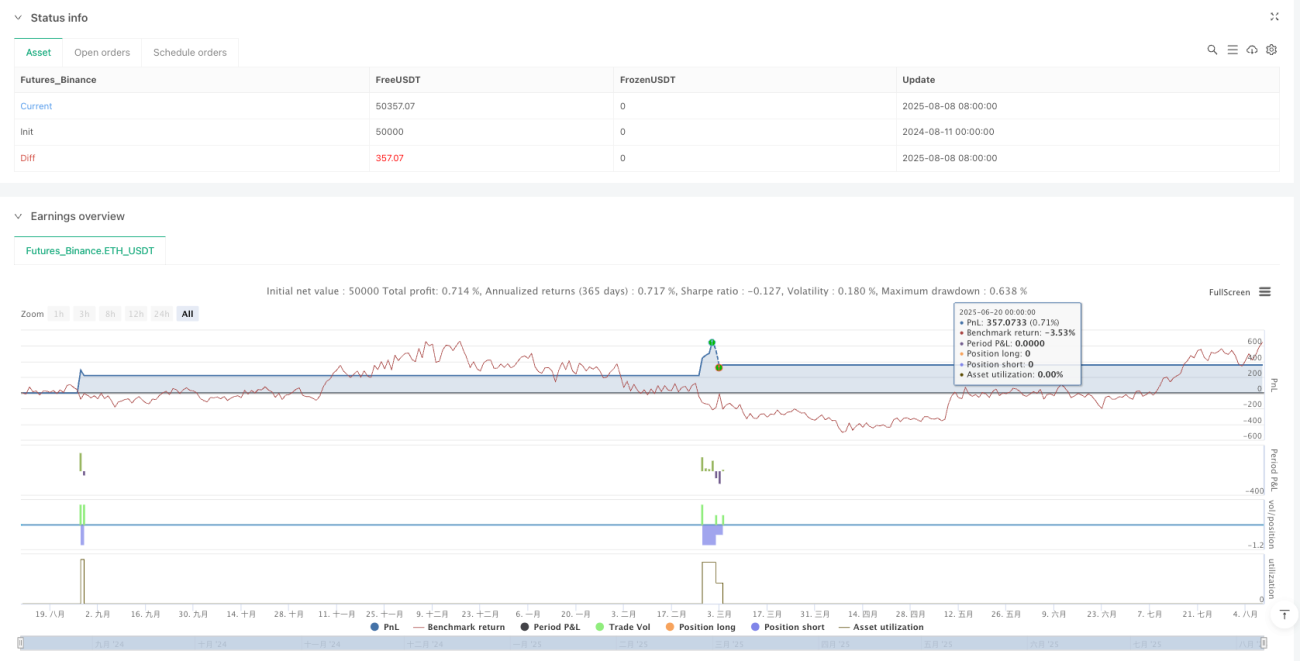
Systematic Risk Management: The strategy incorporates a complete risk management framework, including clear stop-loss settings, partial profit-taking strategies, and trailing stop mechanisms, ensuring controlled risk per trade while allowing profits to continue growing.
-
High Adaptability: While the strategy has default parameter settings, key parameters (such as EMA periods, Bollinger Band length and standard deviation, higher timeframe selection) can all be adjusted according to different market conditions and trading instruments, providing good adaptability.
-
Clear Visual Feedback: The strategy provides clear visual signals (triangle markers and background color changes), allowing traders to easily identify entry points, enhancing the strategy's usability.
Risk Analysis
-
Mean-Reversion Failure Risk: In strongly trending markets, prices may continue to deviate from the mean without reverting, leading to consecutive losing trades. This risk is particularly evident when market structure undergoes fundamental changes (e.g., major news events).
- Solution: Add additional trend strength filters to automatically adjust or pause trading during extreme trend conditions.
-
Parameter Sensitivity: The strategy's performance is sensitive to EMA periods, Bollinger Band parameters, and higher timeframe selection. Inappropriate parameter settings may lead to excessive false signals or missing important trading opportunities.
- Solution: Find the most robust parameter settings by backtesting parameter combinations under different market conditions, or implement adaptive parameter adjustment mechanisms.
-
Slippage and Execution Risk: The strategy uses the previous candle's high/low points as stop-loss levels, which may face serious slippage issues in highly volatile markets.
- Solution: Add stop-loss buffers or use dynamic stop-loss distances based on ATR (Average True Range).
-
Reliance on Historical Patterns Continuing to be Effective: The strategy assumes that historically effective price patterns will remain effective in the future, but market conditions may change.
- Solution: Regularly evaluate strategy performance and adjust parameters or pause trading when market conditions change.
-
Overtrading Risk: In highly volatile but directionless markets, the strategy may generate too many signals, leading to frequent trading and commission erosion.
- Solution: Add trading filter conditions, such as minimum time intervals or strength confirmations, to reduce low-quality trades.
-
Single Market Dependency: The strategy may perform well under specific market conditions but poorly under others.
- Solution: Test the strategy across multiple markets and timeframes, clearly define applicable conditions, or develop multi-strategy combination systems.
Optimization Directions
-
Adaptive Parameter Adjustment: Currently, the strategy uses fixed EMA periods and Bollinger Band parameters. A mechanism for automatic adjustment based on market volatility could be introduced. For example, narrowing Bollinger Bands (reducing standard deviation) during low volatility periods and widening them during high volatility periods. This optimization would better adapt the strategy to different market conditions.
-
Add Trend Strength Filter: ADX (Average Directional Index) or similar indicators could be added to measure trend strength, only trading when trend strength reaches a certain threshold. This would reduce false signals in weak trend or oscillating markets.
-
Improve Stop-Loss Strategy: The current fixed stop-loss could be replaced with dynamic stops based on ATR (Average True Range), better reflecting actual market volatility. Additionally, intelligent stops based on price structure (such as recent support/resistance levels) could be implemented.
-
Add Trading Time Filter: Implementing trading time filters to avoid low liquidity or high volatility market sessions (such as market opening and closing periods) would reduce poor trades caused by abnormal market volatility.
-
Multi-Timeframe Coordination: Beyond the currently used higher timeframe EMA trend confirmation, adding confirmation from more timeframes could form a multi-timeframe coordination system, further improving entry quality.
-
Incorporate Volume Analysis: Combining volume data to confirm the validity of price actions, especially during breakouts and retests of Bollinger Bands, could reduce the risk of false breakouts.
-
Machine Learning Optimization: Utilizing machine learning techniques to optimize parameter selection and signal generation, automatically adjusting strategy behavior based on different market conditions, achieving a higher level of adaptability.
-
Integrate Fundamental Triggers: For markets heavily influenced by fundamentals, consider integrating fundamental data triggers to automatically adjust or pause trading before important economic data releases, avoiding unpredictable high-volatility risks.
Summary
The Higher Timeframe EMA-Trend Heikin-Ashi Bollinger Band Mean-Reversion Strategy is a well-structured quantitative trading system that cleverly combines trend-following and mean-reversion trading concepts. Through Heikin-Ashi candlestick smoothing, Bollinger Band volatility definition, and higher timeframe EMA trend confirmation, the strategy can identify high-probability entry opportunities while reducing market noise.
The core advantages of the strategy lie in its multi-layer confirmation mechanism and complete risk management framework, which enable it to maintain a high win rate while effectively controlling risk. Particularly, its partial profit-taking and trailing stop design both protect realized profits and allow profitable positions to continue growing, reflecting mature trading psychology principles.
However, the strategy also faces risks such as mean-reversion failure, parameter sensitivity, and changing market conditions. By implementing adaptive parameter adjustments, adding trend strength filters, and improving stop-loss strategies, the strategy's robustness and adaptability can be further enhanced.
Ultimately, successful application of this strategy requires traders to understand its basic principles, select appropriate markets and timeframes, and continuously monitor and adjust parameters to adapt to constantly changing market environments. For quantitative traders seeking a balance between technical rigor and practicality, this is a trading system worth considering.
- 1