
Overview
The Adaptive EMA Momentum Crossover Strategy with Dynamic Stop-Loss is a trend-following approach that combines Exponential Moving Average (EMA) and Bollinger Bands (BB). This strategy focuses on upward market trends, determining entry points and stop-loss levels through the relationship between price and EMA, along with dynamic support levels provided by Bollinger Bands. Key features include a fixed risk-reward ratio, dynamic stop-loss adjustment when price shows strength, and a mechanism to prevent immediate re-entry after taking profits, thereby enhancing strategy stability and profitability.
Strategy Principles
The core principles of this strategy are based on several key components:
-
Trend Confirmation: Uses a 40-period EMA as a trend indicator. When price is above the EMA, it's considered to be in an uptrend.
-
Entry Conditions: Only enters a long position when all three conditions are met:
- Closing price is higher than the 40-period EMA
- No current position in the system
- Not waiting for a new crossover (waitForNewCross = false)
-
Dynamic Stop-Loss Setting:
- Initial stop-loss is set at the lower Bollinger Band
- When price closes above the upper Bollinger Band, the stop-loss moves up to the EMA level, providing an adaptive stop-loss mechanism that protects profits when price shows strength
-
Risk Management:
- Uses a 3:1 risk-reward ratio for take-profit setting
- Take-profit calculation: Entry price + (Entry price - Stop-loss) * 3
-
Re-entry Restriction Mechanism:
- When take-profit is triggered, the strategy sets waitForNewCross = true, preventing immediate re-entry
- Only when price crosses below the EMA and then crosses above it again will waitForNewCross be reset to false, allowing new trade signals
Strategy Advantages
Based on code analysis, this strategy has several distinct advantages:
-
Trend-Following Benefit: Confirms trend direction with EMA and only goes long in uptrends, avoiding counter-trend trading.
-
Dynamic Risk Management: Compared to fixed stop-losses, using Bollinger Bands as the initial stop-loss automatically adjusts the stop-loss distance based on market volatility, providing more flexibility to adapt to market changes.
-
Profit Protection Mechanism: When price performs strongly and breaks above the upper Bollinger Band, the stop-loss is raised to the EMA position. This dynamic stop-loss effectively locks in existing profits and prevents excessive drawdowns.
-
Optimized Re-entry Logic: The strategy controls re-entry through the waitForNewCross variable, preventing immediate re-entry after taking profit. It requires price to cross below the EMA and then cross above it again, which helps avoid frequent trading in oscillating markets.
-
Fixed Risk-Reward Ratio: The 3:1 risk-reward ratio ensures that the profit-loss ratio of each trade remains within a controllable range, conducive to long-term stable profits.
-
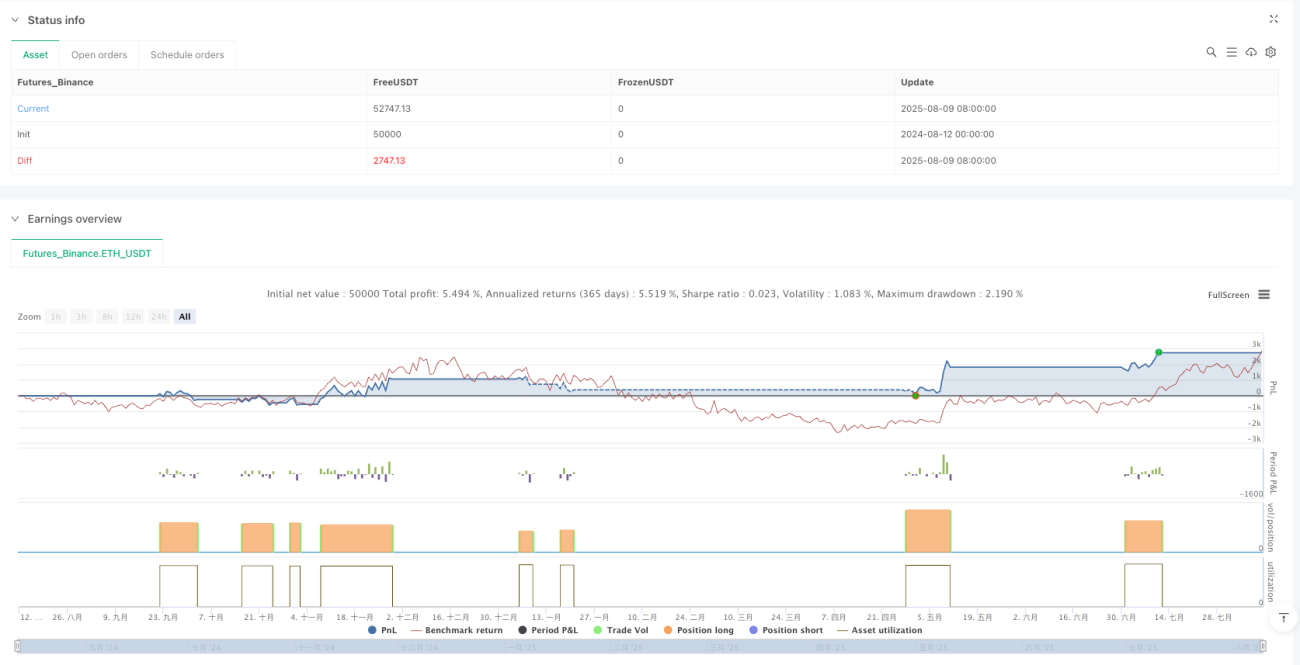
Position Management: The strategy uses a percentage of equity (10%) for position management rather than fixed lot sizes, which is more beneficial for smooth growth of the equity curve.
Strategy Risks
Despite its many advantages, the strategy still has the following risk factors:
-
False Breakout Risk: When price briefly breaks above the EMA and then quickly falls back, it may lead to unnecessary entries and trigger stop-losses. To reduce this risk, consider adding confirmation conditions, such as requiring price to remain above the EMA for multiple consecutive periods.
-
Poor Performance in Oscillating Markets: In oscillating markets without clear trends, frequent price crossings of the EMA may lead to multiple stop-losses. Consider adding trend strength filtering conditions, such as using the ADX indicator to confirm trend strength.
-
Excessive Stop-Loss Distance Risk: In highly volatile markets, Bollinger Band width may be too large, resulting in distant stop-losses and increasing the loss amount per trade. Consider setting a maximum stop-loss percentage limit.
-
Over-reliance on Single Indicators: The strategy mainly relies on EMA and Bollinger Bands, which may cause the strategy to perform poorly in certain specific market environments. It's recommended to add other independent indicators for cross-validation.
-
Fixed Parameter Risk: Fixed EMA period (40) and Bollinger Band standard deviation (0.7) may not be suitable for all market environments. Consider introducing adaptive parameters or setting different parameters for different market environments.
Strategy Optimization Directions
Based on in-depth analysis of the strategy, here are several possible optimization directions:
-
Add Trend Strength Filtering:
- Add ADX indicator filtering, only allowing trades when ADX is greater than a specific value (e.g., 25), avoiding frequent trading in weak trend or oscillating markets
- This helps reduce false signals and improves win rate
-
Optimize Entry Conditions:
- Consider adding price momentum confirmation, such as requiring positive MACD or RSI greater than 50
- Require price to remain above the EMA for multiple consecutive periods, not just a single period
- This helps reduce losing trades from false breakouts
-
Adaptive Parameter Settings:
- Make EMA period and Bollinger Band standard deviation automatically adjust based on market volatility
- For example, increase EMA period and decrease Bollinger Band standard deviation in high-volatility markets; make opposite adjustments in low-volatility markets
- This allows the strategy to better adapt to different market environments
-
Partial Take-Profit Mechanism:
- Implement batch take-profits, such as closing half the position when reaching a 1:1 risk-reward ratio, with a higher take-profit target for the remaining portion
- This balances profit locking and trend following needs
-
Time-Based Exit Mechanism:
- Add time-based exit mechanisms to avoid holding positions for long periods without reaching take-profit levels
- For example, consider closing positions if they have been held for a specific time (e.g., 20 periods) without reaching the take-profit target
-
Market Environment Adaptation:
- Add market type determination logic to use different strategy parameters in different market types (trend, oscillation, high volatility, etc.)
- This can significantly improve strategy stability across various market environments
Summary
The Adaptive EMA Momentum Crossover Strategy with Dynamic Stop-Loss is a well-designed trend-following system that combines EMA and Bollinger Bands to implement dynamic entry, stop-loss, and take-profit management. Its core advantage lies in the ability to automatically adjust stop-loss positions according to market conditions and avoid frequent trading in oscillating markets through the re-entry restriction mechanism.
The strategy's risks are mainly concentrated in fixed parameters and reliance on single indicators, which can be improved by adding trend strength filtering, optimizing entry conditions, introducing adaptive parameter settings, and adding partial take-profit mechanisms. Particularly, adding market environment determination logic allows the strategy to flexibly switch parameters in different market types, improving overall stability and profitability.
Overall, this is a strategy framework with practical application value. Through appropriate parameter optimization and risk management enhancement, it can become a stable and reliable trading system. It is particularly suitable for traders seeking to track medium to long-term trends while effectively controlling risk.
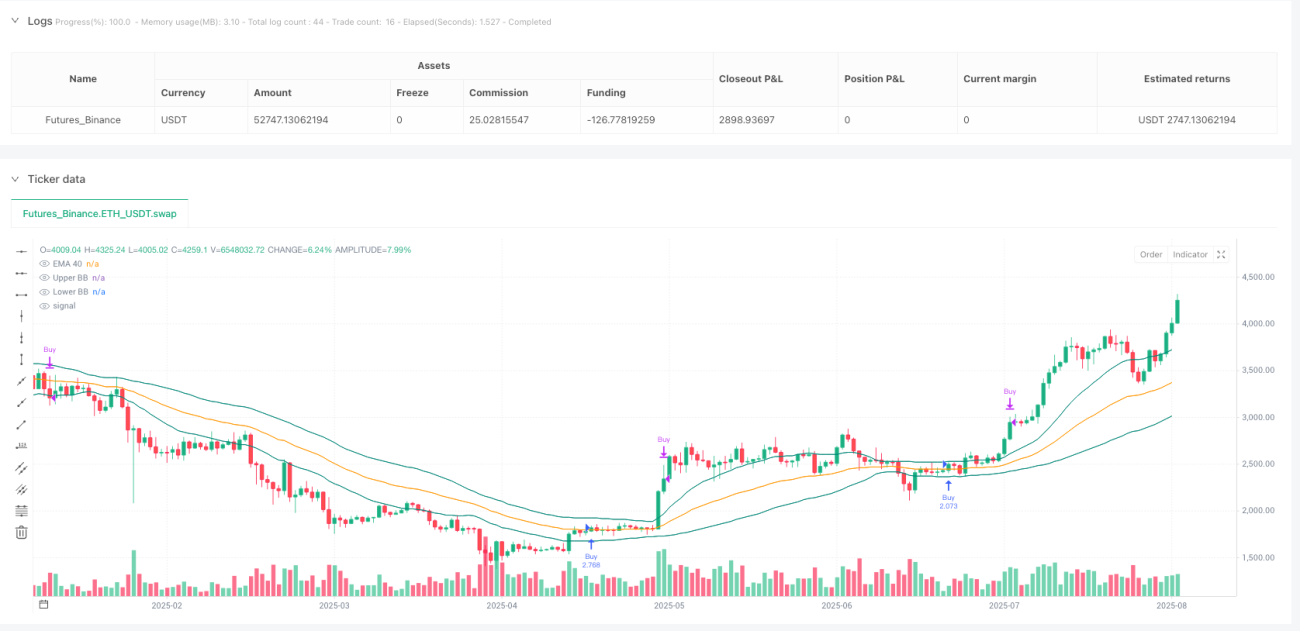
/*backtest
start: 2024-08-12 00:00:00
end: 2025-08-10 08:00:00
period: 1d
basePeriod: 1d
exchanges: [{"eid":"Futures_Binance","currency":"ETH_USDT"}]
*/

//@version=5
strategy("Buy-Only: 40 EMA + BB(0.7) [with TP reset]", overlay=true, default_qty_type=strategy.percent_of_equity, default_qty_value=10)

// === INPUTS ===- 1