
Overview
This strategy is a bidirectional trading system that combines the Relative Strength Index (RSI) and Average Directional Index (ADX). The strategy identifies overbought and oversold signals through an 8-period RSI, filtered by a 20-period ADX for trend strength, capturing reversal opportunities in strong trends. The system employs manual ADX calculation, precisely measuring trend strength through smoothed directional movement (DM) and true range (TR) processing. With 10% position sizing and support for both long and short operations, the strategy is suitable for instruments with clear trending characteristics.
Strategy Principle
The core logic is based on the synergistic effect of two technical indicators. First, an 8-period RSI serves as the primary trade signal generator, producing long signals when RSI crosses above 70 and short signals when crossing below 30. This contrarian logic is based on the market characteristic of mean reversion from extreme values.
Second, the strategy introduces ADX as a trend strength filter. The ADX calculation process includes: computing upward movement (upMove) and downward movement (downMove), determining positive directional movement (+DM) and negative directional movement (-DM), calculating positive directional indicator (+DI) and negative directional indicator (-DI) through RMA smoothing, and finally deriving the ADX value through normalized DI difference calculation. Only when ADX exceeds 14, indicating a clear market trend, are RSI signals considered valid.
The exit mechanism uses opposite RSI extremes as position closing signals: long positions close when RSI falls below 30, and short positions close when RSI rises above 70. This design ensures timely exits when trends may reverse.
Strategy Advantages
-
Dual Filtering Mechanism: RSI provides precise entry timing while ADX ensures trading only in clear trends, effectively reducing false signals in ranging markets.
-
Flexible Bidirectional Trading: The strategy can capture both upward and downward trends, improving capital efficiency and providing profit opportunities in different market environments.
-
Reasonable Parameter Optimization: 8-period RSI is more sensitive than the traditional 14-period, capturing market changes faster; 20-period ADX provides stable trend judgment; the ADX threshold of 14 is a market-validated effective level.
-
Strict Risk Control: 10% position sizing and clear stop-loss exit rules effectively control single trade risk.
-
Accurate and Reliable Calculations: Manual ADX implementation avoids potential version differences in built-in functions, ensuring strategy consistency across different platforms.
Strategy Risks
-
Reversal Trading Risk: In extremely strong trends, RSI may remain in overbought or oversold states for extended periods, leading to premature entries with significant floating losses. Consider adding secondary trend strength confirmation, such as price breakouts of key support/resistance levels.
-
Lag Issues: ADX as a trend-following indicator has inherent lag, potentially confirming trends only near their end. Consider combining price action or volume indicators for auxiliary judgment.
-
Range Market Performance: While ADX filters some ranging action, frequent entry/exit signals may occur when ADX values hover near the threshold. Consider setting an ADX buffer zone, requiring ADX>15 for entry while allowing ADX>13 during position holding.
-
Extreme Market Risk: In rapid one-sided markets, contrarian operations may face enormous losses. Consider adding maximum loss limits or time-based stop mechanisms.
Optimization Directions
-
Dynamic Parameter Adjustment: Dynamically adjust RSI periods and ADX thresholds based on market volatility. Use longer periods during high volatility to reduce noise, and shorter periods during low volatility to increase sensitivity.
-
Multi-Timeframe Confirmation: Add higher timeframe trend confirmation to current timeframe signals, ensuring trade direction aligns with the major trend.
-
Position Sizing Optimization: Dynamically adjust positions based on ADX strength, with stronger trends receiving larger positions. Consider pyramid scaling strategies, gradually increasing positions after trend confirmation.
-
Stop-Loss Optimization: Beyond RSI reversal signal stops, add ATR-based trailing stops to protect profits while allowing positions adequate volatility space.
-
Enhanced Signal Filtering: Add auxiliary conditions like volume confirmation and price pattern recognition to improve signal quality. For example, require volume expansion on breakouts or execute trades only near key support/resistance levels.
Summary
The RSI-ADX Bidirectional Momentum Filtering Trading Strategy is an elegantly designed quantitative trading system that captures market opportunities while controlling risk by combining the advantages of momentum and trend indicators. The strategy's core innovation lies in using trend strength to filter momentum signals, avoiding single indicator limitations. Despite inherent reversal trading risks, the strategy demonstrates good practicality through reasonable parameter settings and strict risk control. Future optimizations should focus on improving signal quality and risk-reward ratios, particularly performance under extreme market conditions. Overall, this is a quantitative strategy framework worthy of in-depth research and live trading validation.
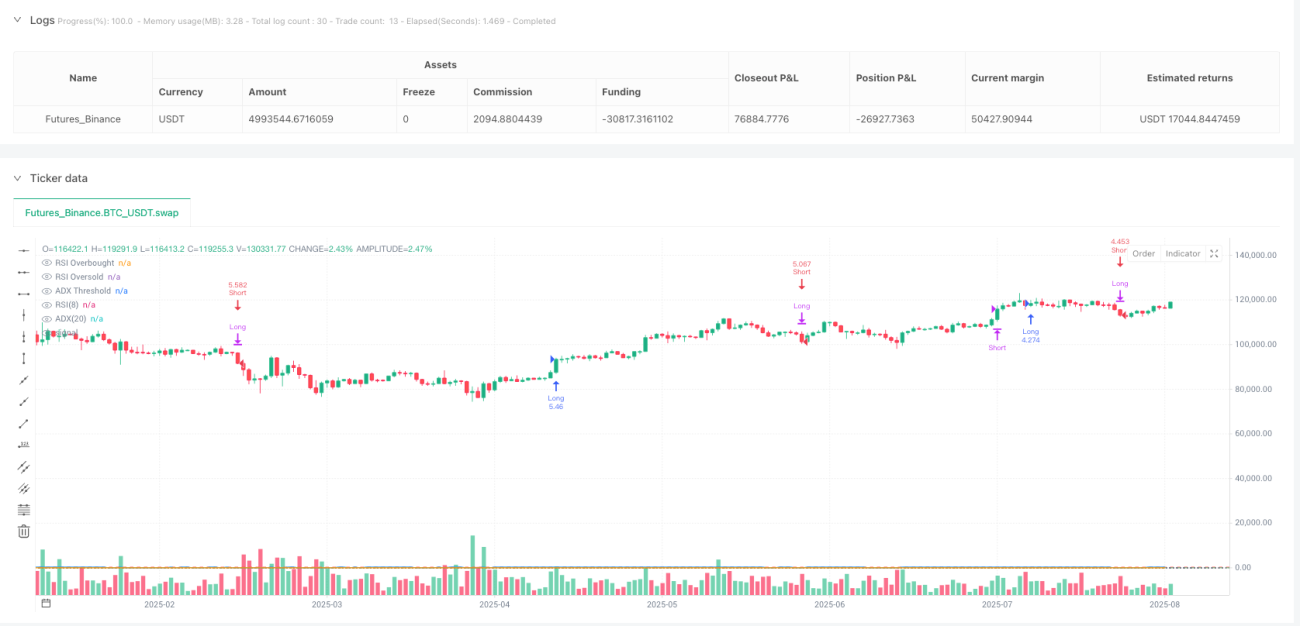
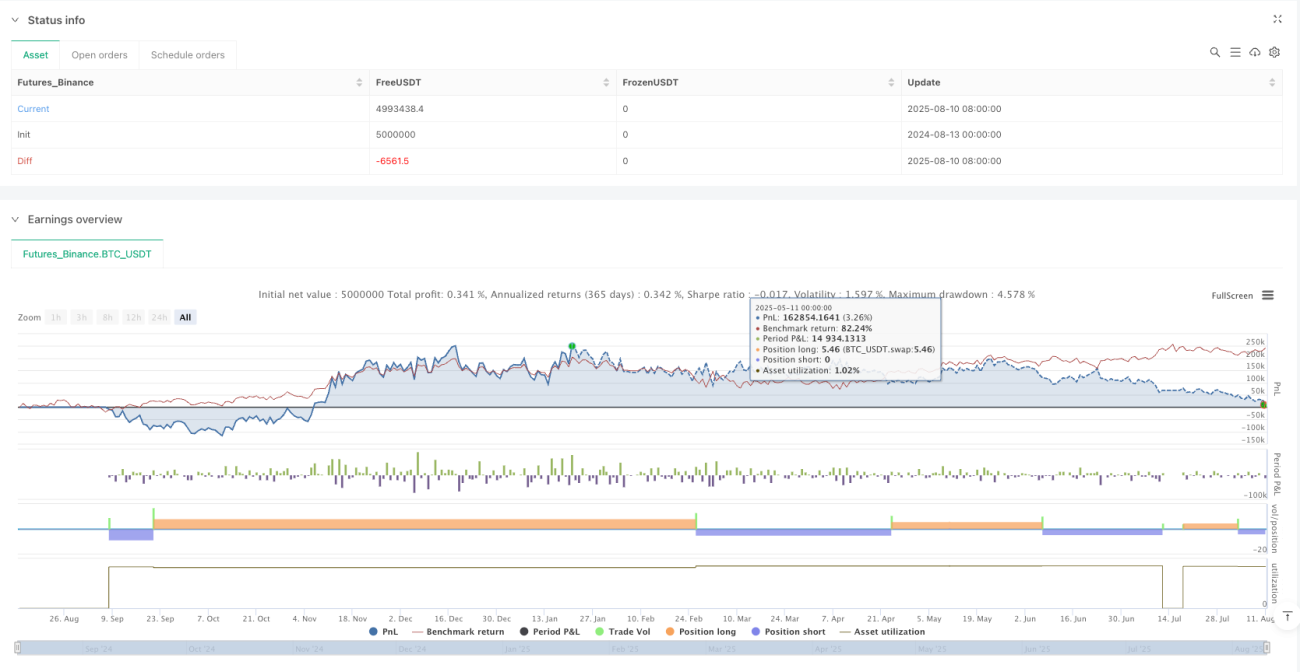
/*backtest
start: 2024-08-13 00:00:00
end: 2025-08-11 08:00:00
period: 1d
basePeriod: 1d
exchanges: [{"eid":"Futures_Binance","currency":"BTC_USDT","balance":5000000}]
*/

//@version=6
strategy("RSI & ADX Long/Short Strategy v6 (Manual ADX)", overlay=true,
     margin_long=100, margin_short=100,
default_qty_type=strategy.percent_of_equity, default_qty_value=10)- 1