

Strategy Overview
The EMA Crossover Momentum RSI Filter Trading Strategy is a meticulously designed quantitative trading system created for traders who value simplicity, clarity, and high performance. This strategy is primarily applied to 1-hour timeframe market charts, filtering out market noise to focus on capturing key market turning points. The core logic is straightforward: buy when the market turns upward and sell when it turns downward.
The strategy employs a combination of Exponential Moving Averages (EMA) and the Relative Strength Index (RSI), identifying high-probability trading opportunities through the crossover of short-term and long-term trends confirmed by momentum indicators. This approach not only excels in trending markets but is also suitable for swing trading in highly volatile market environments.
Strategy Principles
The core principles of this strategy are based on the synergistic action of two main technical indicators:
-
Exponential Moving Average (EMA) Crossover: The strategy uses a 7-period EMA as the fast line and a 21-period EMA as the slow line. A buy signal is generated when the fast line crosses above the slow line; a sell signal is generated when the fast line crosses below the slow line. This crossover reflects moments when short-term momentum exceeds the long-term trend, typically an early signal of trend reversal.
-
Relative Strength Index (RSI) Filter: To improve signal quality, the strategy uses an 11-period RSI as a filtering condition. Buy signals require RSI confirmation above 50, indicating sufficient upward momentum; sell signals require RSI below 42, confirming the market has entered a relatively weak zone.
-
Position Tracking Mechanism: The strategy tracks the current position status through the variable
lastPos, ensuring that new trading operations are triggered only when signals differ from the current position direction, avoiding redundant entries and optimizing capital management. -
Direct Position Conversion: When a new signal appears, the strategy immediately closes the opposite position and establishes a new position without waiting for additional confirmation, ensuring quick response to market changes.
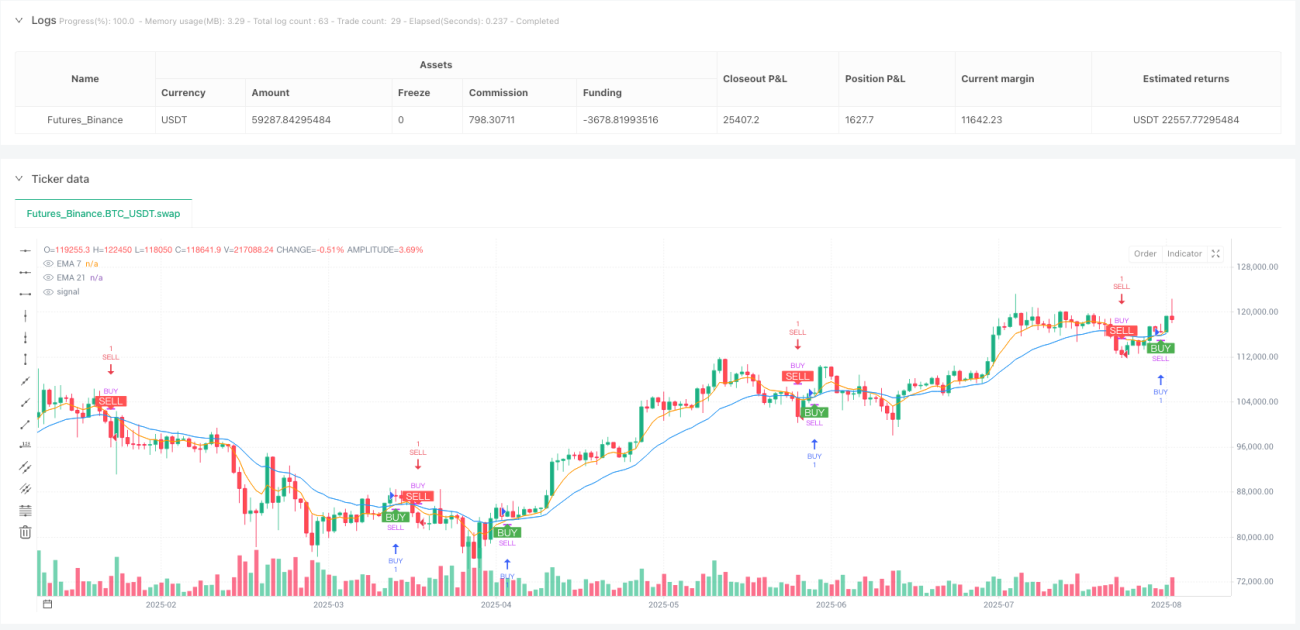
The code implements clear signal visualization, marking buy and sell points on the chart, helping traders intuitively understand strategy behavior while maintaining a clean interface.
Strategy Advantages
-
Clear and Concise Trading Logic: The strategy design is extremely simple, relying only on two commonly used technical indicators (EMA and RSI), avoiding the problems of excessive optimization and curve fitting caused by complex indicator stacking.
-
Rapid Signal Identification and Execution: Through clear crossover conditions and RSI filtering, the strategy can capture signals in the early stages of trend changes and immediately execute position conversions, improving timeliness.
-
Strong Adaptability: Although the strategy is designed for the 1-hour timeframe, its core principles are applicable to various markets and timeframes, demonstrating strong adaptability.
-
Reduced Overtrading: Through position tracking mechanisms and momentum confirmation, the strategy effectively reduces false signals and overtrading, focusing on high-probability trading opportunities.
-
Intuitive Visual Feedback: The strategy clearly marks buy and sell signals on the chart while displaying EMA indicator lines, allowing traders to intuitively understand strategy behavior and market structure.
-
Streamlined Parameters: The strategy uses only a few key parameters (EMA 7/21, RSI 11), making it easy to understand and adjust, reducing the risk of overfitting.
Strategy Risks
-
Mid-Price Fluctuation Risk: In strong trending markets, the strategy may identify reversal signals too early, leading to premature exit from trends. This issue can be mitigated by adjusting RSI thresholds or adding trend strength filters.
-
Frequent Trading in Ranging Markets: During price consolidation phases, EMA crossovers may occur frequently, resulting in multiple ineffective trades. It is recommended to consider adding volatility filtering conditions or temporarily disabling the strategy when ranging markets are identified.
-
Single Timeframe Dependency: The strategy relies solely on signals from a single timeframe, lacking multi-timeframe confirmation, which may lead to oversensitivity to short-term fluctuations. Consider adding longer timeframe trend filtering to improve signal quality.
-
Parameter Sensitivity: The choice of EMA and RSI parameters significantly impacts strategy performance, requiring adjustment and optimization based on specific market conditions. Traders should conduct thorough historical backtesting and parameter sensitivity analysis before live trading.
-
Lack of Stop-Loss Mechanism: The current strategy implementation lacks an explicit stop-loss mechanism, relying entirely on reverse signals for position closure, which may result in significant losses under extreme market conditions. It is recommended to add fixed stop-loss or volatility-based stop-loss mechanisms in practical applications.
Strategy Optimization Directions
-
Multi-Timeframe Analysis Integration: The strategy can be enhanced by integrating longer timeframe trend directions (such as 4-hour or daily) as additional filtering conditions to improve signal quality. For example, execute hourly signals only when consistent with the daily trend direction.
-
Dynamic Parameter Adjustment: EMA and RSI parameters can be dynamically adjusted based on market volatility, using longer periods during high volatility and shorter periods during low volatility to improve strategy adaptability.
-
Stop-Loss and Profit Management: Add intelligent stop-loss mechanisms, such as ATR multiple stops or key support/resistance level stops, and introduce partial profit-locking mechanisms to optimize risk-reward ratios.
-
Volume Filter Enhancement: The current strategy calculates volume indicators but doesn't fully utilize them. Consider adding volume confirmation conditions, requiring volume to be above average when signals are generated, improving signal reliability.
-
Machine Learning Optimization: Consider using machine learning methods to dynamically assess market environments and signal quality, adjusting strategy parameters or pausing trading under different market conditions.
-
Drawdown Control Mechanism: Introduce risk management mechanisms based on account drawdown, automatically reducing position size or pausing trading when consecutive losses or account drawdown reaches specific thresholds, protecting capital safety.
Conclusion
The EMA Crossover Momentum RSI Filter Trading Strategy is a well-designed quantitative trading system that effectively captures market turning points while maintaining simplicity by combining EMA crossovers and RSI momentum filtering. The strategy is particularly suitable for 1-hour timeframe market trading, efficiently identifying trend changes and promptly executing position adjustments.
The main advantages of the strategy lie in its clear and concise trading logic, fast signal identification and execution capabilities, and intuitive visual feedback. However, traders should also be aware of potential issues such as frequent trading risks in ranging markets, single timeframe dependency, and lack of stop-loss mechanisms.
To further enhance strategy performance, consider integrating multi-timeframe analysis, implementing dynamic parameter adjustments, strengthening stop-loss and profit management mechanisms, adding volume filtering conditions, and introducing drawdown control systems. Through these optimizations, traders can build more robust and adaptive trading systems.
Finally, although this strategy shows good potential, traders should still adhere to sound risk management principles, conduct thorough historical backtesting and forward validation, and make appropriate adjustments based on personal risk tolerance and market conditions. Remember, there is no perfect trading strategy; the key is finding methods that suit your trading style and market environment.
- 1