
Overview
The Dynamic Trend Capture System is a quantitative trading strategy based on Simple Moving Average (SMA) crossover signals, focusing on capturing medium to long-term market trends. The core of this strategy utilizes the Golden Cross and Death Cross between the 50-day and 200-day simple moving averages as trading signals, executing long positions only. When the short-term SMA (50-day) crosses above the long-term SMA (200-day) forming a Golden Cross, the system generates a buy signal; when the short-term SMA crosses below the long-term SMA forming a Death Cross, the system exits the position. This strategy operates on a daily timeframe and aims to capture medium to long-term uptrends while avoiding downtrends.
Strategy Principles
This strategy is based on classic trend-following theory in technical analysis, with the following core logic:
-
Moving Average Crossover Signals: The strategy employs 50-day and 200-day simple moving averages, which are widely used standard parameters in the market.
- Golden Cross: When the 50-day SMA crosses above the 200-day SMA, indicating short-term momentum exceeds long-term trend, suggesting a potential uptrend.
- Death Cross: When the 50-day SMA crosses below the 200-day SMA, indicating short-term momentum is weaker than the long-term trend, suggesting a potential downtrend.
-
Trading Rules:
- Entry Condition: When a Golden Cross occurs, if there is no current position (controlled by the
onlyOneTradeAtATimeparameter), the system opens a long position. - Exit Condition: When a Death Cross occurs, the system closes all positions.
- Position Management: By default, 100% of account equity is used for trading, adjustable through input parameters.
- Entry Condition: When a Golden Cross occurs, if there is no current position (controlled by the
-
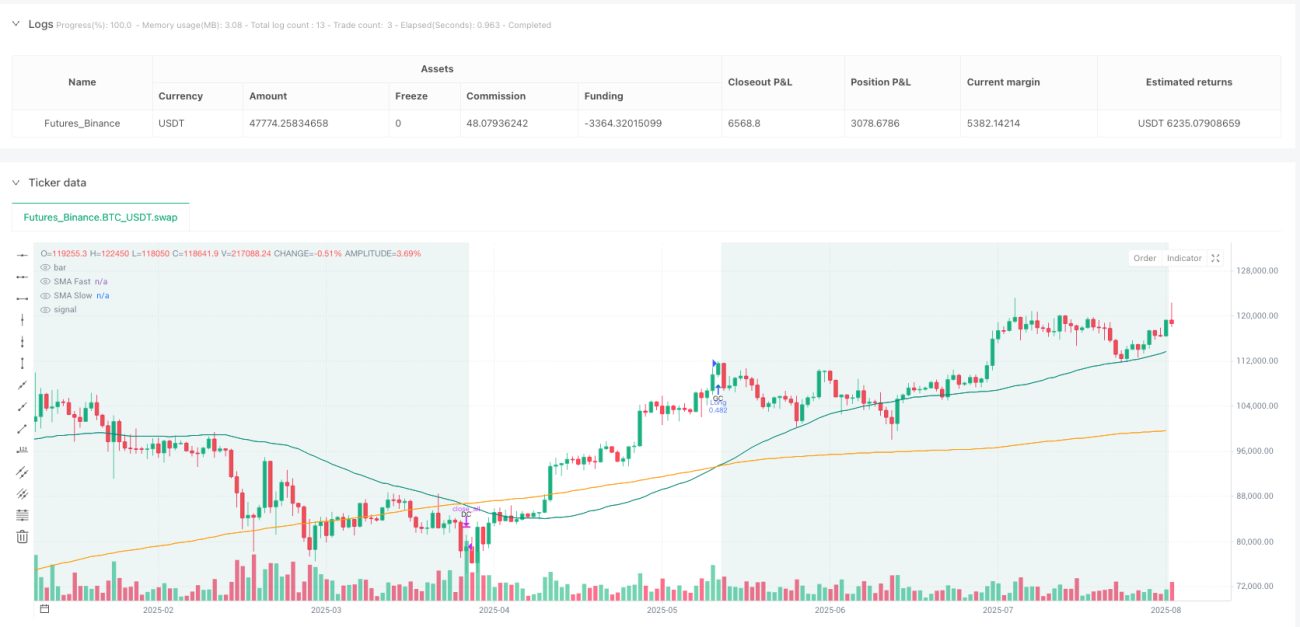
Visual Markers:
- The strategy marks Golden Crosses (upward triangles) and Death Crosses (downward triangles) on the chart.
- During position holding periods, the chart background displays a light green color.
- The two moving averages are displayed in different colors: 50-day SMA in teal, 200-day SMA in orange.
-
Risk Control:
- The strategy sets a 0.05% trading commission.
- Pyramiding is disabled (pyramiding=0).
- Provides an option to block re-entry, preventing additional entries when a position is already open.
Strategy Advantages
-
Simple and Effective: The strategy logic is straightforward, easy to understand and implement, requiring no complex indicator combinations or parameter optimization.
-
Trend-Following Capability: By capturing crossovers between two moving averages with substantial time spans, it effectively filters market noise and identifies medium to long-term trend changes.
-
Risk Management Mechanism: The Death Cross signal provides a clear exit point, helping to control downside risk and protect profits.
-
Long-Only Limitation: The strategy only executes long trades, avoiding the additional risks and complexities of short selling, particularly suitable for upward-trending markets.
-
Flexibility:
- Customizable periods for fast and slow SMAs.
- Option to allow or block re-entry after position closure.
- Adjustable capital allocation ratio.
-
Visual Assistance: The strategy clearly marks crossover signals and position status on the chart, allowing traders to intuitively assess market conditions.
-
Alert Functionality: Built-in alert conditions for Golden Cross and Death Cross events, providing timely notifications to traders.
Strategy Risks
-
Lag Effect: Moving averages are inherently lagging indicators, especially the 200-day SMA which responds slowly, potentially causing significant delays in entry and exit signals. In rapidly reversing markets, this may result in missing important turning points.
-
Ineffective in Ranging Markets: In sideways, consolidating markets, this strategy may generate frequent false signals, leading to consecutive losing trades.
-
Drawdown Risk: Since the strategy only exits on a Death Cross, the market may have already undergone a significant correction before forming a Death Cross, resulting in profit erosion.
-
Parameter Sensitivity: While 50-day and 200-day are common parameters, they may not be suitable for all markets and periods. Different parameter choices can lead to drastically different results.
-
Single Technical Indicator Dependency: The strategy relies solely on SMA crossovers without incorporating other confirmation indicators, potentially increasing the risk of false signals.
-
Capital Management Risk: Using 100% of capital for each trade by default lacks diversification in capital allocation, potentially leading to excessive concentration risk.
-
Trading Cost Impact: Although trading commissions are set, other trading costs such as slippage and taxes in actual trading will also affect strategy performance.
Strategy Optimization Directions
-
Add Confirmation Indicators:
- Incorporate volume indicators to confirm the validity of trend changes.
- Add oscillators such as Relative Strength Index (RSI) or Stochastic to filter false signals.
- Consider including trend strength indicators like MACD or ADX to evaluate trend reliability.
-
Improve Entry and Exit Mechanisms:
- Implement partial position management, such as phased entries on Golden Cross.
- Add stop-loss mechanisms, not solely relying on Death Cross.
- Consider using support/resistance levels or volatility channels as additional exit conditions.
-
Dynamic Parameter Adjustment:
- Implement adaptive adjustment of SMA periods based on market volatility changes.
- Consider using Exponential Moving Averages (EMA) instead of SMA to increase sensitivity to recent price movements.
-
Market Environment Filtering:
- Add market state assessment functionality, enabling the strategy only in trending markets.
- Consider using ATR or other volatility indicators to adjust position size.
- Adjust strategy parameters based on seasonality or market cycle characteristics.
-
Capital Management Optimization:
- Implement dynamic position sizing based on market risk levels or historical strategy performance.
- Design phased scaling in and scaling out rules to optimize capital efficiency.
- Add maximum drawdown control mechanisms.
-
Backtesting and Validation Improvements:
- Conduct more comprehensive backtesting across different market conditions and time periods.
- Implement Walk-Forward Testing to evaluate strategy robustness.
- Consider adding Monte Carlo simulations to analyze potential risk scenarios.
Summary
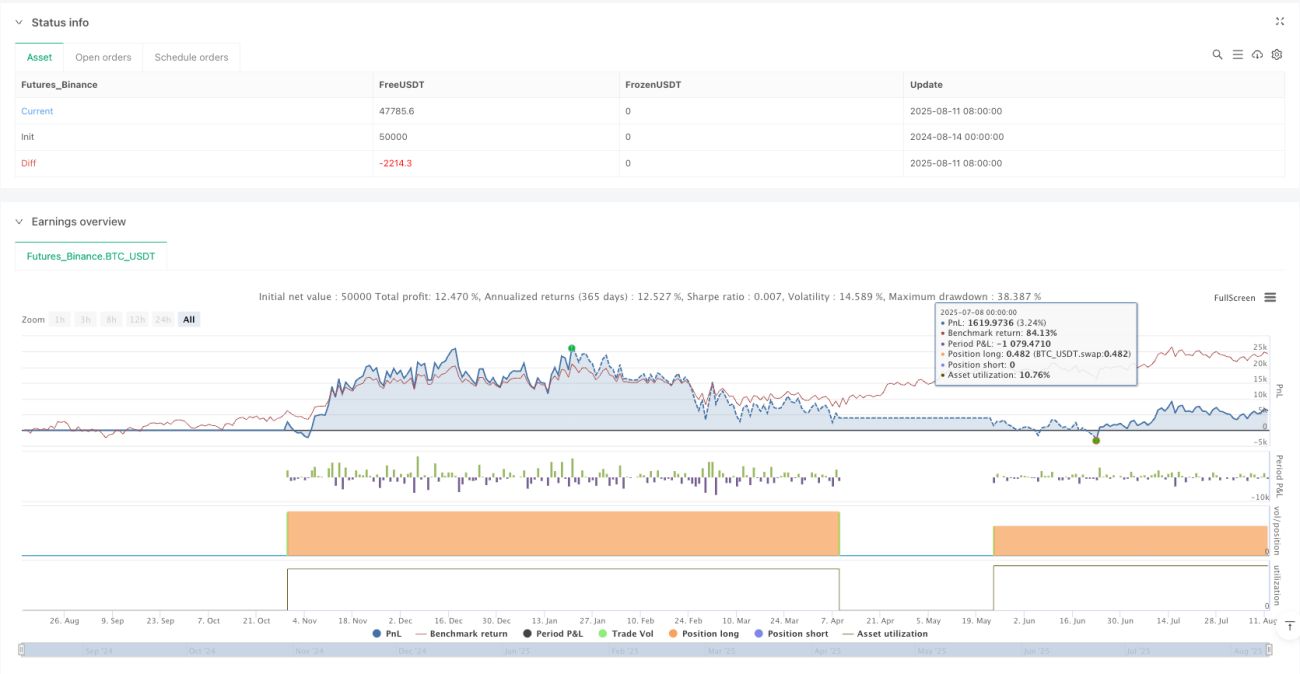
The Dynamic Trend Capture System is a classic trend-following strategy based on SMA Golden Cross and Death Cross, with its simplicity and effectiveness making it a common method in quantitative trading. This strategy is particularly suitable for capturing medium to long-term trends and performs well in consistently rising markets.
However, as a system based on lagging indicators, this strategy may face challenges in rapidly changing markets or ranging conditions. By adding confirmation indicators, improving entry and exit mechanisms, implementing dynamic parameter adjustments, and optimizing capital management, the robustness and performance of the strategy can be significantly enhanced.
Ultimately, the success of any trading strategy depends on proper implementation, continuous monitoring, and appropriate risk management. Traders should make necessary adjustments and optimizations to the strategy based on their risk tolerance and investment objectives.
- 1