Multi-Timeframe Supertrend EMA Momentum Filtering Strategy

Overview
This strategy is an advanced trend-following system that combines the Supertrend indicator with multiple momentum filters, designed specifically to capture strong trends. Its core utilizes the Supertrend indicator with dynamically adjusted ATR (Average True Range), complemented by EMA (Exponential Moving Average) and DEMA (Double Exponential Moving Average) as trend confirmation tools, while integrating RSI (Relative Strength Index) and volume filters to enhance entry signal credibility. The strategy features built-in ATR-based stop-loss, take-profit, and trailing stop mechanisms, offering parameter presets for multiple timeframes to accommodate different trading styles. Notably, the strategy includes intelligent re-entry logic that captures pullback opportunities during uptrends, effectively capturing continuation rallies.
Strategy Principles
The core principle of this strategy is based on a multi-layered signal confirmation mechanism, constructing a comprehensive trading decision framework:
-
Supertrend Core Signal System: Uses ATR to calculate dynamic trend bands, generating buy signals when the closing price breaks above the lower band (upflip) and sell signals when breaking below the upper band (downflip). ATR period and multiplier are adjustable to adapt to volatility in different market environments.
-
Momentum Confirmation Filter: Requires price to be above both short-term EMA (default 21-period) and long-term DEMA (default 200-period), ensuring trade direction aligns with the main trend and avoiding counter-trend trades.
-
Signal Strength Verification: Confirms price momentum through RSI (default >50) and market participation with volume greater than its EMA (default 20-period), improving entry signal quality.
-
Intelligent Re-entry Mechanism: During confirmed uptrends, the strategy re-enters when price pulls back and then crosses back above the EMA while meeting other conditions, effectively capturing opportunities in trend continuation.
-
Risk Management System:
- Stop-loss set at 1 ATR below entry price (default)
- Take-profit set at 3 ATR above entry price (optional)
- Trailing stop activated once profit exceeds 1 ATR, securing partial profits
-
Multi-timeframe Parameter Presets:
- "Auto-1H/4H": ATR period 10, multiplier 3, suitable for short-term swing trading
- "Auto-1D": ATR period 14, multiplier 3, ideal for daily trend following
- "Auto-1W": ATR period 20, multiplier 4, designed for long-term trend capture
Strategy Advantages
After in-depth analysis, this strategy demonstrates the following significant advantages:
-
Strong Adaptability: The Supertrend indicator dynamically adjusts based on ATR, automatically adapting to changes in market volatility and maintaining effectiveness across different market environments.
-
Multi-layer Confirmation Reduces False Signals: Multiple verifications through EMA, DEMA, RSI, and volume significantly reduce the risk of false signals, improving trade quality.
-
Intelligent Re-entry Captures Continuation Moves: The innovative re-entry logic allows re-entering after pullbacks during uptrends, effectively utilizing volatility within trends and improving capital efficiency.
-
Comprehensive Risk Management System: Built-in ATR-based stop-loss, take-profit, and trailing stop mechanisms both limit single trade losses and effectively protect accumulated profits, reducing drawdown risk.
-
Multi-timeframe Presets Simplify Operation: Preset parameters for different timeframes make the strategy easy to implement across various trading periods, accommodating different traders' time preferences.
-
Visual Assistance Provides Clarity: Color-filled areas distinguish between uptrends and downtrends, combined with clear buy/sell signal markers, making market conditions immediately apparent and facilitating trading decisions.
-
Validated Through Backtesting: Shows approximately 60% win rate and profit factor greater than 4 on daily timeframes, particularly suitable for markets with distinct trends.
Strategy Risks
Despite its comprehensive design, the strategy still presents the following potential risks:
-
Underperformance in Choppy Markets: In range-bound markets without clear trends, stop-losses may be frequently triggered, resulting in accumulated small losses. The solution is to pause trading when market structure is unclear or increase the ATR multiplier to reduce signal sensitivity.
-
Filtering Conditions May Miss Opportunities: While multiple filtering conditions improve signal quality, they may cause missed opportunities in early trend stages. Traders should consider adjusting filter strictness based on personal risk preferences.
-
Parameter Sensitivity: ATR period and multiplier settings significantly impact strategy performance, with different market environments potentially requiring different parameters. Backtesting is recommended to optimize parameter settings for specific markets.
-
Drawdown Risk: Backtesting shows potentially large drawdowns (up to 100%+) when using full position sizing. Strict money management must be implemented, limiting risk to 1-2% per trade.
-
Historical Data Limitations: The strategy has primarily been backtested in specific markets and time periods, posing potential overfitting risk. More extensive testing across various markets and time periods is advisable before live implementation.
-
Lack of Testing in Extreme Market Conditions: The strategy may not have been tested under extreme situations such as severe market volatility or liquidity crises, making its performance under such conditions unknown.
Optimization Directions
Through deep code analysis, the strategy can be optimized in the following directions:
-
Adaptive Parameter Adjustment: Develop mechanisms to dynamically adjust ATR multipliers and periods based on market volatility, allowing the strategy to automatically adapt to changing market conditions. For example, increase ATR multiplier when volatility rises and decrease it when volatility falls.
-
Integrate Market State Classification: Introduce a market state recognition module (using Bollinger Band width, ADX, etc.) to automatically adjust strategy parameters or pause trading based on whether the market is trending or oscillating.
-
Multi-timeframe Analysis Framework: Add multi-timeframe analysis functionality, requiring higher timeframe trends to align with the current timeframe before executing trades, improving trend judgment accuracy.
-
Optimize Re-entry Logic: Refine re-entry conditions by considering Fibonacci retracement levels or key support confirmations to improve re-entry precision.
-
Money Management Optimization: Implement dynamic position sizing based on market volatility, account equity, and consecutive profit/loss status to automatically adjust position size and optimize equity curve performance.
-
Add Market Sentiment Indicators: Integrate market sentiment indicators such as the VIX index (volatility index) or volume change rates to adjust strategy behavior during market panic or excessive optimism.
-
Machine Learning Optimization: Utilize machine learning algorithms to optimize parameter selection and entry timing by training models on historical data to predict optimal trading parameter combinations.
Summary
The Multi-Timeframe Supertrend EMA Momentum Filtering Strategy is a well-designed trend-following system that establishes a comprehensive trading decision framework by combining the Supertrend indicator with multiple momentum filters. Its core strengths lie in strong adaptability, multi-layer confirmation to reduce false signals, intelligent re-entry to capture continuation moves, and a comprehensive risk management system. The strategy is particularly suitable for markets with clear trends, demonstrating good backtesting performance on daily timeframes.
However, the strategy may underperform in choppy markets and exhibits parameter sensitivity and potential drawdown risks. To further enhance strategy robustness, consider developing adaptive parameter adjustments, integrating market state classification, building multi-timeframe analysis frameworks, optimizing re-entry logic, improving money management approaches, adding market sentiment indicators, and applying machine learning techniques.
Ultimately, this strategy provides a technically rigorous framework with sound risk management for trend-following trading, but users should always remember the importance of risk control, limiting each trade's risk to an acceptable range, and appropriately adjusting strategy parameters based on personal trading style and market environment.
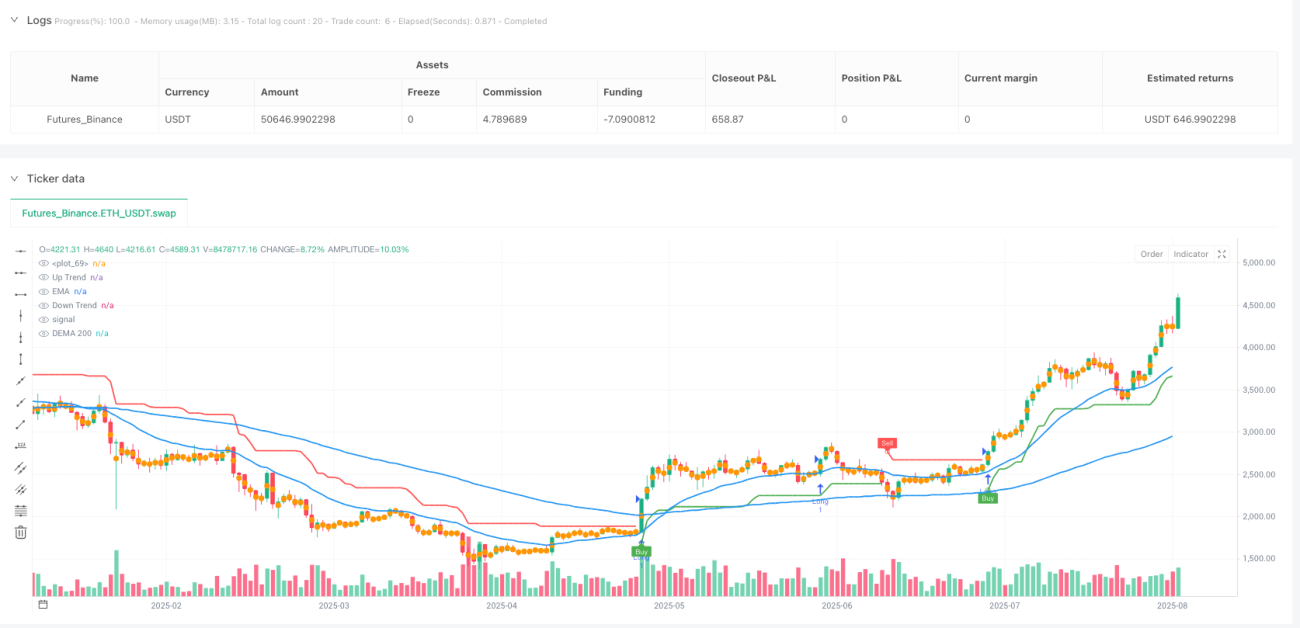
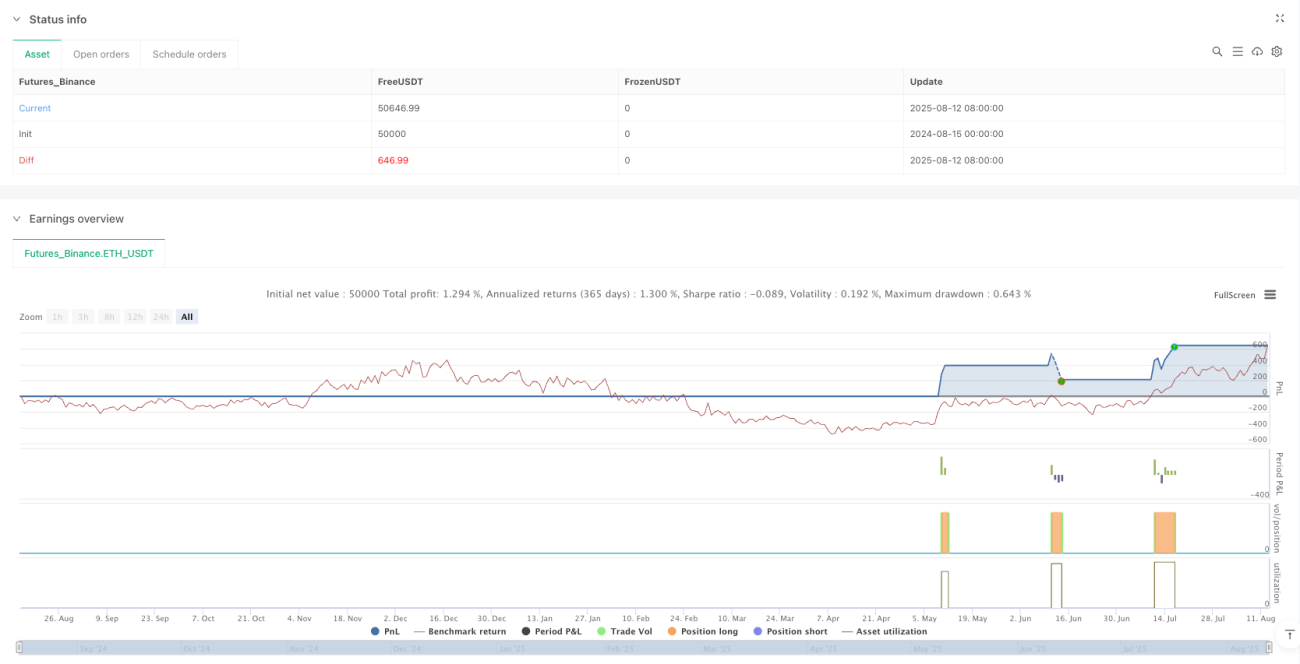
/*backtest
start: 2024-08-15 00:00:00
end: 2025-08-13 08:00:00
period: 1d
basePeriod: 1d
exchanges: [{"eid":"Futures_Binance","currency":"ETH_USDT"}]
*/

//@version=5
strategy("Supertrend EMA Strategy _V29", overlay=true, format=format.price, precision=2, initial_capital=1000)
// Inputs
tf_preset = input.string("Manual", title="Timeframe Preset", options=["Manual", "Auto-1H/4H", "Auto-1D", "Auto-1W"])- 1