Adaptive Trend Channel Regression Trading Strategy

Overview
The Adaptive Trend Channel Regression Trading Strategy is a quantitative trading system based on linear regression channels and ATR volatility. This strategy identifies market trends by constructing parallel channels and generates trading signals when prices approach channel boundaries. It is particularly suitable for markets with clear trends, automatically adjusting channel width to adapt to different market volatility conditions while providing clear stop-loss and take-profit levels.
Strategy Principles
The core of this strategy is a trend channel built on linear regression. First, the strategy uses a specified length (default 50 periods) linear regression to determine the baseline trend line, which reflects the overall price direction. Then, the channel width is calculated based on the ATR (Average True Range) indicator by multiplying the ATR value by a user-defined multiplier (default 2.0). This method allows the channel width to dynamically adjust according to market volatility.
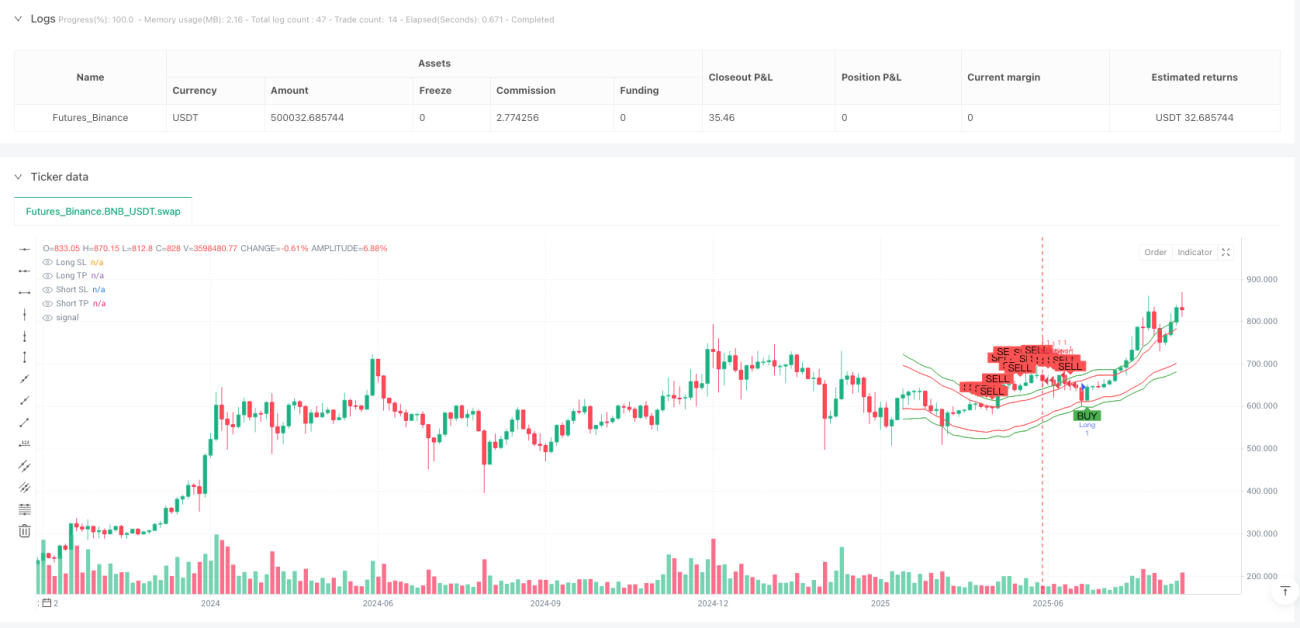
The channel consists of three parts: the baseline (solid yellow line), the upper boundary (green dashed line), and the lower boundary (red dashed line), as well as a middle line (orange dotted line). The strategy determines trend direction by calculating the slope of the linear regression: a positive slope indicates an uptrend, while a negative slope indicates a downtrend.
Trade signal generation logic is as follows:
- Buy signal: Generated when in an uptrend (positive slope) and price is near the lower channel boundary (specifically within 20% of the channel width from the lower boundary)
- Sell signal: Generated when in a downtrend (negative slope) and price is near the upper channel boundary (specifically within 20% of the channel width from the upper boundary)
The strategy automatically sets stop-loss and take-profit levels:
- Long stop-loss is set at the lower channel boundary
- Long take-profit is set at the middle line position plus 1.5 times the channel width (adjustable)
- Short stop-loss is set at the upper channel boundary
- Short take-profit is set at the middle line position minus 1.5 times the channel width (adjustable)
Additionally, the strategy offers a hedging mode option that can send independent long and short signals to external execution systems, particularly suitable for brokers supporting true hedging (such as MT5/Exness).
Strategy Advantages
-
Strong Adaptability: By combining linear regression and ATR indicators, this strategy can adapt to different market conditions and volatility environments. The channel width automatically adjusts according to market volatility, making the strategy applicable across different assets and timeframes.
-
Clear Trend Identification: The linear regression channel provides an objective judgment of trend direction, avoiding the lag commonly found in traditional technical indicators. By calculating the slope of the regression line, the strategy can clearly distinguish between uptrends and downtrends.
-
Precise Reversal Point Capture: The strategy generates signals when prices approach channel boundaries, which are typically key points for potential reversals or trend resumptions, improving the success rate of trades.
-
Comprehensive Risk Management: The strategy has built-in dynamic stop-loss and take-profit mechanisms. Stop-loss levels are set at channel boundaries, providing clear risk control for each trade; take-profit levels are calculated based on channel width, proportional to market volatility, ensuring profit-taking at reasonable positions.
-
Flexible Execution Options: The hedging mode option accommodates different broker and trading platform requirements, particularly suitable for complex trading strategies requiring simultaneous long and short positions.
-
Visualized Trading Interface: The strategy clearly displays channel lines, entry signals, and stop-loss/take-profit levels on the chart, allowing traders to intuitively understand market conditions and strategy logic.
Strategy Risks
-
False Breakout Risk: In oscillating markets, prices may frequently touch channel boundaries without forming effective breakouts, leading to frequent trading and consecutive losses. This can be mitigated by adding confirmation indicators (such as momentum indicators) or extending signal confirmation time.
-
Inadequate Adaptation to Trend Turning Points: Linear regression is based on historical data and may not react quickly enough when trends suddenly reverse, causing missed important market turning points. Consider introducing short-term trend indicators as supplements to increase sensitivity to market turning points.
-
Parameter Optimization Challenges: Strategy effectiveness highly depends on parameters such as regression length, ATR period, and channel width multiplier. Different markets and timeframes may require different parameters, necessitating historical backtesting to find optimal parameter combinations.
-
High Volatility Market Risk: In highly volatile markets, ATR values can rise rapidly, resulting in excessively wide channels that may miss trading opportunities or set stop-loss levels too far. Consider setting maximum limits for channel width or using smoothed ATR values.
-
Technical Limitations: The strategy relies on TradingView's alert system and external execution mechanisms, which may be affected by network delays, alert frequency limitations, and other technical factors. Implementing monitoring systems is recommended to ensure signals are transmitted and executed promptly and effectively.
Strategy Optimization Directions
-
Multi-Timeframe Confirmation: The current strategy generates signals on a single timeframe. Introducing a multi-timeframe analysis framework requiring higher timeframe trend direction to align with trading signals would improve trade success rates. This optimization can filter out low-probability trades against the major trend.
-
Dynamic Parameter Adjustment Mechanism: Introduce an adaptive parameter adjustment mechanism that automatically adjusts regression length and channel width multiplier based on market conditions (such as volatility, volume, trend strength). This can be achieved by calculating market state indicators (such as volatility ratio, trend strength index).
-
Enhanced Signal Filters: Introduce additional filtering conditions such as volume confirmation, momentum consistency checks, or volatility thresholds to reduce false signals. For example, require volume to increase in the signal direction or momentum indicators to align with price direction.
-
Optimized Entry Timing: The current strategy generates signals when prices approach channel boundaries. Consider waiting for price bounce or pullback confirmation before entering to improve win rate. This can be implemented by detecting price reversal patterns after touching boundaries.
-
Machine Learning Integration: Use machine learning algorithms such as random forests or neural networks to predict signal reliability based on historical data, assigning probability scores to each signal and only executing high-probability trades. This requires building a feature engineering framework to extract meaningful market features.
-
Tiered Position Management: Implement a dynamic position sizing system that adjusts position size for each trade based on signal strength, market conditions, and account risk assessment. For example, increase positions in strong trends and reduce positions when trends weaken.
Summary
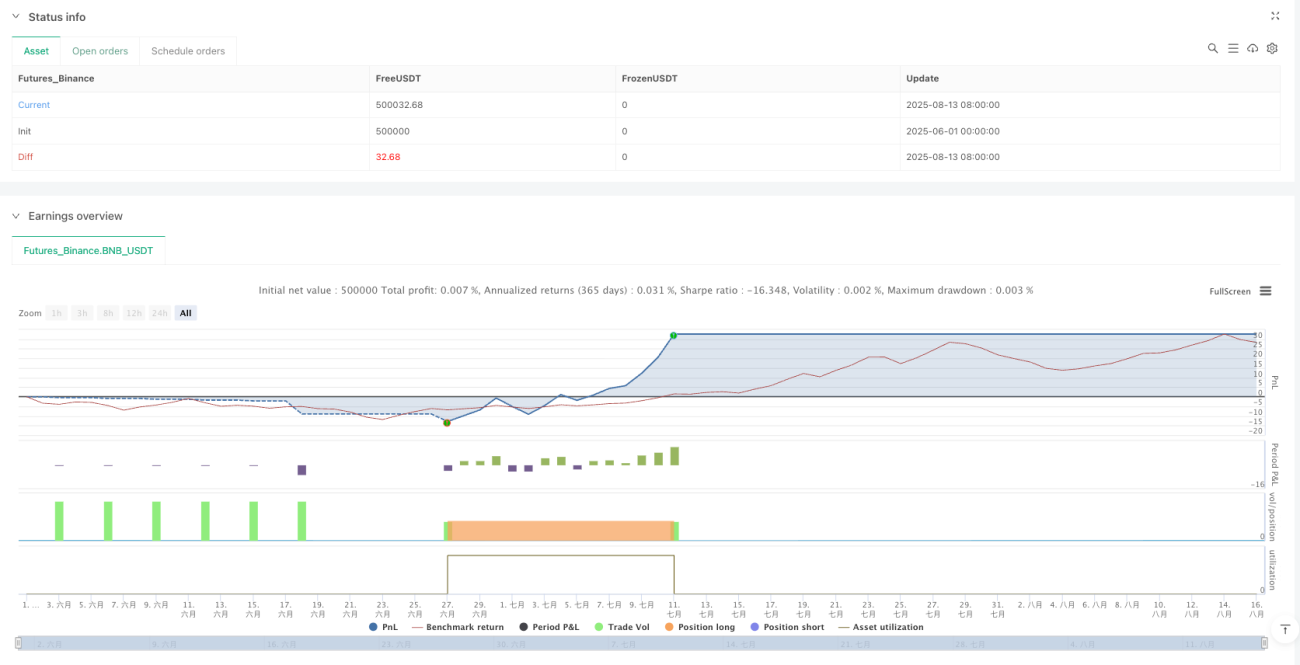
The Adaptive Trend Channel Regression Trading Strategy is a systematic trading method combining linear regression and ATR volatility, identifying market trends and potential trading opportunities through dynamically adjusting parallel channels. The core advantages of this strategy lie in its adaptability and clear risk management framework, maintaining stability across different market environments.
This strategy is particularly suitable for medium to long-term trend trading, capturing trend continuation opportunities by entering when prices pull back to channel boundaries. Through its built-in hedging functionality, the strategy can also serve as a foundation component for market-neutral strategies, enhancing overall portfolio stability.
However, like any trading strategy, limitations exist, and traders should be mindful of false breakout risks and adjust parameter settings according to different market characteristics. By implementing the suggested optimization directions, especially multi-timeframe confirmation and dynamic parameter adjustment, the strategy's robustness and profitability can be further enhanced.
- 1