
Overview
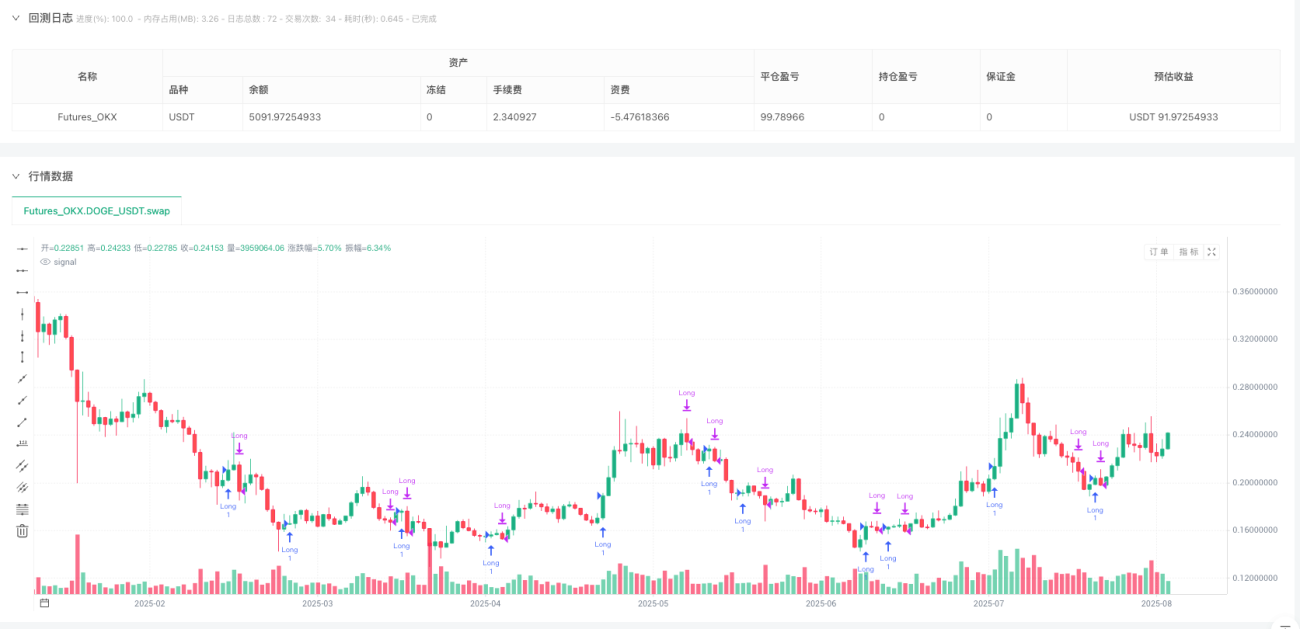
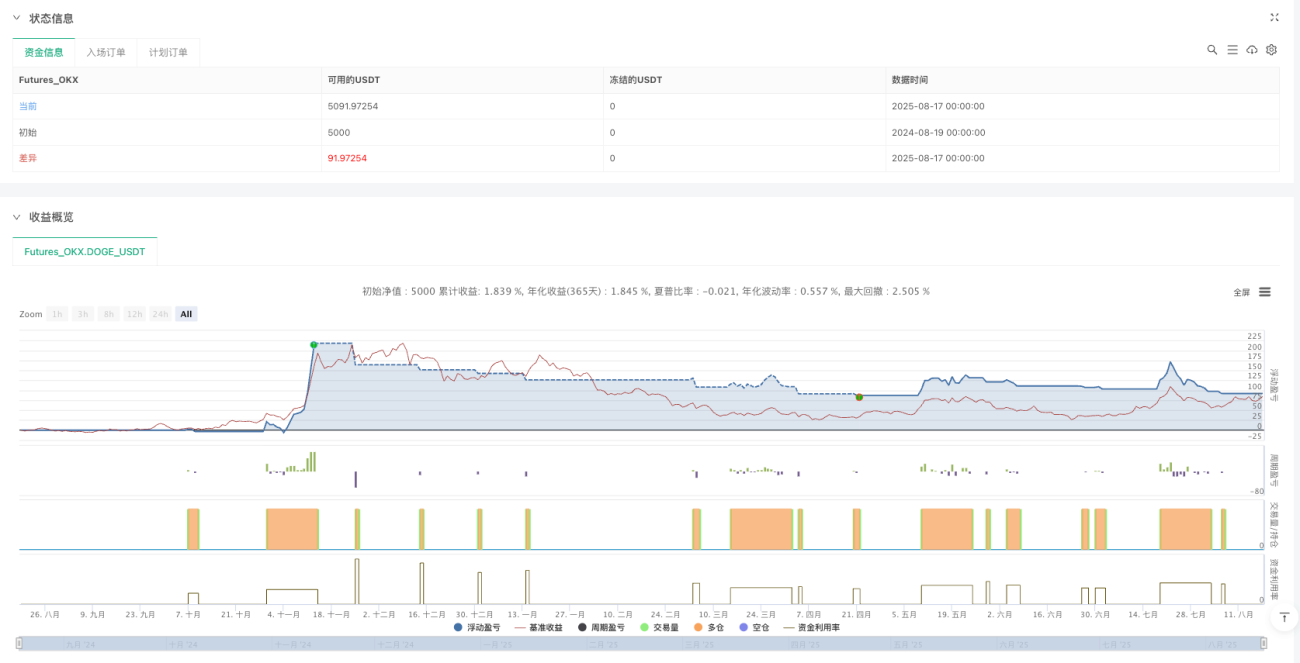
The Dual Red to Dual Green Trend Reversal EMA Breakthrough Strategy is a quantitative trading approach based on candlestick pattern transitions and EMA indicator analysis. The core concept identifies market patterns where two consecutive red candles are followed by two green candles, typically signaling that a short-term downtrend may be ending and market sentiment is shifting upward. The strategy incorporates both short-term and long-term Exponential Moving Averages (EMAs) as trend references and features customizable take-profit and stop-loss parameters for flexible risk management. According to backtesting results, this strategy demonstrates approximately a 61% win rate under specific market conditions, indicating its effectiveness in identifying trend reversal points.
Strategy Principles
The strategy operates based on the following key principles:
-
Candlestick Pattern Recognition: The core trading signal comes from identifying a specific pattern of two consecutive red candles (close below open) followed by two consecutive green candles (close above open). In technical analysis, this pattern is viewed as a potential trend reversal signal, suggesting that selling pressure is weakening and buyers are gaining control.
-
EMA Indicator Support: The strategy employs two exponential moving averages (default parameters of 10 and 50) to help confirm the overall market trend context. The short-term EMA (10) reflects recent price dynamics, while the long-term EMA (50) provides a broader trend context. Although EMAs are not direct entry conditions, they provide important trend background information for trading decisions.
-
Custom Take-Profit Mechanism: The strategy adopts a fixed amount take-profit method, automatically closing positions when the price rises above the entry price plus a preset profit amount (default 0.15 units). This approach allows traders to precisely set profit targets based on market volatility characteristics and personal risk preferences.
-
Percentage-Based Stop-Loss Control: Risk management is implemented through percentage-based stop-loss, triggering when the price falls below a preset percentage (default 2%) of the entry price. This method makes the stop-loss amount proportional to the actual entry price, better aligning with real market volatility.
-
Capital Management: The strategy defaults to using 10% of total capital for each trade, which helps achieve compound growth and reduces risk exposure for individual trades.
The execution flow is as follows: when the dual red to dual green pattern is detected, the system establishes a long position at the current closing price, then dynamically monitors price movements, automatically closing the position once the take-profit amount is reached or the stop-loss percentage is triggered, completing a full trading cycle.
Strategy Advantages
Through in-depth analysis of the code, this strategy demonstrates the following significant advantages:
-
Pattern Recognition Accuracy: By looking for a clear pattern of two consecutive red candles followed by two green candles, the strategy can capture potential trend reversal points. This multiple confirmation mechanism helps reduce false signals and improves entry quality.
-
Customizable Risk Management: The strategy allows traders to flexibly set take-profit amounts and stop-loss percentages according to different markets and personal risk tolerance, achieving personalized risk control. The percentage-based stop-loss design, in particular, enables risk control to adapt to assets at different price levels.
-
Visualized Trade Marking: The code includes detailed trade marking functionality, clearly indicating buy, take-profit, and stop-loss points on the chart, providing intuitive visual feedback for strategy backtesting and optimization.
-
Integrated Capital Management: The strategy adopts a percentage-of-equity approach for position management (default_qty_value=10), meaning that as account funds grow, trading size correspondingly increases, facilitating compound growth effects.
-
Parameter Adjustability: The EMA lengths, take-profit amount, and stop-loss percentage can all be customized, allowing traders to fine-tune the strategy according to different market conditions and trading cycles, enhancing adaptability.
-
Clear and Straightforward Operation: The strategy logic is intuitive and concise, without complex mathematical calculations or ambiguous conditions, enabling traders to clearly understand the reasons behind each trading decision, helping to build trading confidence.
Strategy Risks
Despite its numerous advantages, several potential risk points need attention:
-
False Breakthrough Risk: The dual red to dual green pattern does not always indicate a true trend reversal; under certain market conditions, it may only be a temporary rebound before continuing the original trend. Mitigation method: Consider adding additional confirmation indicators, such as volume breakouts or momentum indicator confirmation.
-
Limitations of Fixed Amount Take-Profit: The current strategy uses a fixed amount as the take-profit criterion, which may not be flexible enough for assets at different price levels. For high-priced assets, a fixed amount may be too small, while for low-priced assets, it may be too large. Improvement plan: Consider changing the take-profit to a percentage-based method to accommodate assets at different price levels.
-
Lack of Trend Filtering: Although the strategy calculates EMA indicators, they are not used as entry filtering conditions, which may lead to counter-trend trading in strong trending markets. Solution: Add EMA crossovers or price-to-EMA relationship as additional filtering conditions.
-
Insufficient Drawdown Control: The strategy relies solely on a single percentage-based stop-loss to control risk, lacking special handling mechanisms for consecutive losses. Enhancement plan: Consider introducing maximum daily loss limits or temporary trading suspension mechanisms after consecutive losses.
-
Missing Time-Based Exit Mechanism: The current strategy only exits when the price reaches take-profit or stop-loss levels, lacking time-based exit mechanisms, which may result in capital being locked in consolidating markets for extended periods. Optimization direction: Add exit conditions based on holding time, such as closing positions if specific days pass without reaching the take-profit target.
-
Parameter Optimization Overfitting Risk: The effectiveness of the strategy largely depends on the settings of EMA lengths, take-profit, and stop-loss parameters. Improper parameter optimization may lead to overfitting historical data. Preventive measures: Use sufficiently long historical data and multi-market validation to ensure parameter robustness.
Strategy Optimization Directions
Based on in-depth analysis of the strategy code, here are several possible optimization directions:
-
Enhanced Trend Filtering: Integrate EMA indicators into entry conditions, for example, only considering entry when the price is above the short-term EMA and the short-term EMA crosses above the long-term EMA. This ensures that the trading direction aligns with the larger market trend, improving success rates.
-
Dynamic Take-Profit Mechanism: Change the fixed amount take-profit to a dynamic take-profit mechanism, such as based on ATR (Average True Range) multiples or percentage methods. This allows profit targets to match actual market volatility, capturing more profit in high volatility and protecting existing gains in low volatility.
-
Multiple Timeframe Analysis: Introduce higher timeframe trend confirmation, only executing trades when the higher timeframe trend direction aligns with the trading direction. This helps improve strategy stability across different market phases.
-
Volume Confirmation: Use volume as an additional confirmation indicator, requiring volume to show certain amplification characteristics when forming the dual red to dual green pattern, enhancing pattern recognition reliability.
-
Intelligent Position Management: Dynamically adjust position size based on market volatility and historical win rates, increasing positions when high-confidence signals appear and reducing risk exposure during periods of high uncertainty.
-
Market State Classification: Classify the current market state (e.g., trending market, ranging market) before executing the strategy, and adjust strategy parameters or trading logic for different market states, enabling the strategy to better adapt to various market environments.
-
Partial Take-Profit Mechanism: Introduce a staged position closing mechanism, closing part of the position when reaching the first target price and setting higher take-profit targets for the remaining position. This secures certain profits while not missing opportunities in major market movements.
These optimization directions can not only improve the strategy's overall performance but also enhance its adaptability and robustness across different market environments.
Summary
The Dual Red to Dual Green Trend Reversal EMA Breakthrough Strategy is a quantitative trading system combining candlestick pattern recognition with EMA indicators. Its core advantage lies in using clear price pattern signals to capture potential trend turning points while implementing flexible risk management through customizable take-profit and stop-loss parameters. The strategy's 61% win rate indicates its effectiveness under specific market conditions.
However, the strategy also has risk points such as false pattern breakouts, limitations of fixed amount take-profits, and insufficient trend filtering. By introducing enhanced trend filtering, dynamic take-profit mechanisms, multiple timeframe analysis, and other optimization measures, the strategy's performance and robustness can be further improved.
For traders, this strategy provides a relatively straightforward and customizable trading framework, suitable for investors seeking combinations of pattern trading and technical indicators. In practical application, it is recommended that traders first test in a simulated environment and adjust parameters according to specific market characteristics, while combining broader market analysis to enhance decision accuracy. Through continuous monitoring and optimization, the Dual Red to Dual Green Trend Reversal EMA Breakthrough Strategy has the potential to become an effective component in trading systems.
- 1